How contributions affect your rate of return
Try using this handy time-weighted return calculator
Advertisement
Try using this handy time-weighted return calculator
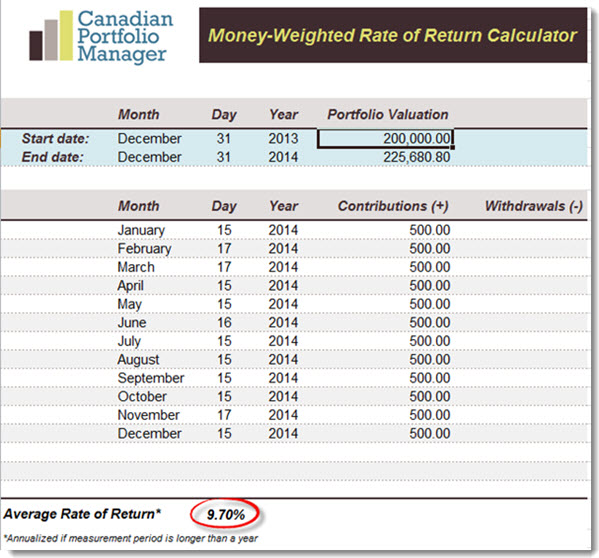
 Then Buster calculates the annual return on his RRSP using Justin Bender’s Money-Weighted Rate of Return Calculator. He simply enters the starting value of the portfolio ($200,000), the ending value from his December 2014 account statement ($225,680.80), and the date and amount of each contribution he made during the year:
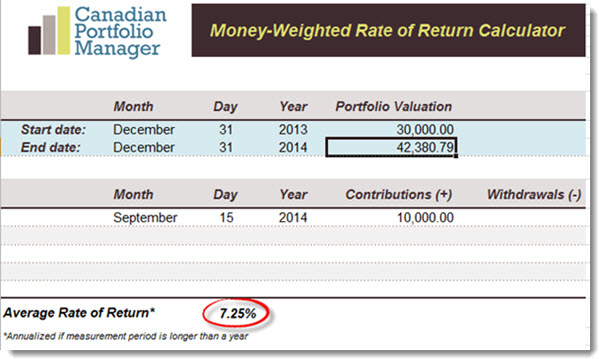
 He then does the same for his TFSA: now Buster uses a starting value of $30,000 and a final value of $42,380.79, and then he enters the date and amount of his one lump-sum contribution:
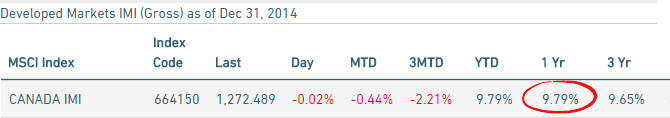
 When the results are in, Buster is shocked to find that his RRSP performed very similarly to the index (it lagged by just 0.09%), but his TFSA appeared to underperform by more than 2.5%. Since both accounts have identical holdings, shouldn’t the returns have been the same?
Not necessarily. Had Buster measured his performance using a time-weighted rate of return (TWRR), the figures for his TFSA and RRSP would have been identical, and they would have matched the returns of the MSCI index. But because Buster used a money-weighted method, he got different results for the two accounts. Now he wants to know why.
The culprit turns out to be the size and the timing of the contributions he made to his two accounts. While a TWRR (the method used by ETFs, mutual funds and index benchmarks) is not affected by cash flows, contributions and withdrawals will affect an investor’s MWRR. The degree of influence depends on two factors:
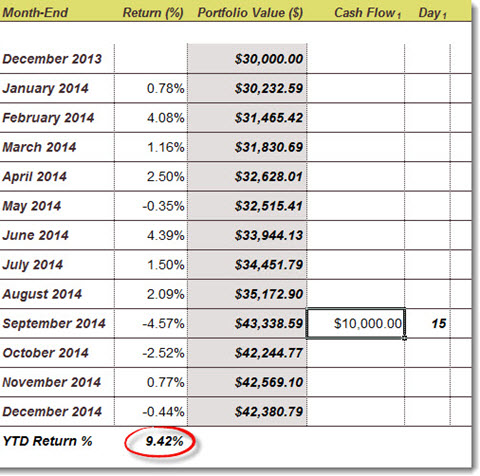
The size of the cash flows in relation to the overall portfolio. In Buster’s RRSP, each $500 contribution represented only about 0.25% of his account. These relatively small cash flows will have little effect on the portfolio’s MWRR. But Buster’s lump-sum TFSA contribution was about 33% of the account’s starting value, so it had a significant impact. That’s why the return on his TFSA was so far off the index benchmark.
The timing of the cash flows. Buster’s TFSA contribution in September wasn’t just large, it also came at a bad time: just before a sharp downturn in the Canadian equity market. That unlucky timing had a negative effect on his MWRR. Had the markets moved sharply upward after his contribution, he would have seen a much higher MWRR. Meanwhile, his smaller RRSP contributions were spread over 12 months, which reduced the effect of timing.
When the results are in, Buster is shocked to find that his RRSP performed very similarly to the index (it lagged by just 0.09%), but his TFSA appeared to underperform by more than 2.5%. Since both accounts have identical holdings, shouldn’t the returns have been the same?
Not necessarily. Had Buster measured his performance using a time-weighted rate of return (TWRR), the figures for his TFSA and RRSP would have been identical, and they would have matched the returns of the MSCI index. But because Buster used a money-weighted method, he got different results for the two accounts. Now he wants to know why.
The culprit turns out to be the size and the timing of the contributions he made to his two accounts. While a TWRR (the method used by ETFs, mutual funds and index benchmarks) is not affected by cash flows, contributions and withdrawals will affect an investor’s MWRR. The degree of influence depends on two factors:
The size of the cash flows in relation to the overall portfolio. In Buster’s RRSP, each $500 contribution represented only about 0.25% of his account. These relatively small cash flows will have little effect on the portfolio’s MWRR. But Buster’s lump-sum TFSA contribution was about 33% of the account’s starting value, so it had a significant impact. That’s why the return on his TFSA was so far off the index benchmark.
The timing of the cash flows. Buster’s TFSA contribution in September wasn’t just large, it also came at a bad time: just before a sharp downturn in the Canadian equity market. That unlucky timing had a negative effect on his MWRR. Had the markets moved sharply upward after his contribution, he would have seen a much higher MWRR. Meanwhile, his smaller RRSP contributions were spread over 12 months, which reduced the effect of timing.
 Let’s return to the question I referred to at the top: “How would the performance of the model portfolios have been different if an investor added money each month?” Because the model portfolio performance is reported using TWRRs, the answer is that monthly contributions would make no difference at all.
It would be possible to run the model portfolio performance numbers again using a MWRR, but you would need to assign an arbitrary starting value and an arbitrary amount for each contribution. The results would be meaningless for any investor whose situation was not exactly the same as those assumptions—which would be everyone.
For DIY investors interested in measuring their own portfolios against the models, an approximate time-weighted return using Justin’s calculator is likely to be the most useful method.
This article was originally published at canadiancouchpotato.com.
Let’s return to the question I referred to at the top: “How would the performance of the model portfolios have been different if an investor added money each month?” Because the model portfolio performance is reported using TWRRs, the answer is that monthly contributions would make no difference at all.
It would be possible to run the model portfolio performance numbers again using a MWRR, but you would need to assign an arbitrary starting value and an arbitrary amount for each contribution. The results would be meaningless for any investor whose situation was not exactly the same as those assumptions—which would be everyone.
For DIY investors interested in measuring their own portfolios against the models, an approximate time-weighted return using Justin’s calculator is likely to be the most useful method.
This article was originally published at canadiancouchpotato.com.
Share this article Share on Facebook Share on Twitter Share on Linkedin Share on Reddit Share on Email