How mutual funds and ETFs really get results
Fund companies will give the credit to the genius of the manager, but there’s a way you can tease out a more complete explanation: it’s called factor analysis.
Advertisement
Fund companies will give the credit to the genius of the manager, but there’s a way you can tease out a more complete explanation: it’s called factor analysis.
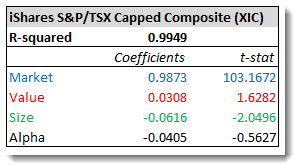 OK, let’s unpack all the jargon. The first key number is the R-squared, which tells you how well the data fit the model. In this case, a figure of 0.9949 indicates the three factors we’ve analyzed explain 99.49% of the performance of XIC. It’s an almost perfect fit.
Now look at the numbers in the “Coefficients” column. These are correlation coefficients, which measure the relationship between two variables—in this case, the fund’s monthly returns and each of the factors. A coefficient of +1 indicates the variables have perfect positive correlation: they move in the same direction by the same amount. A value of –1 indicates perfect negative (or inverse) correlation: the variables move in opposite directions. A value of zero means the variables move independently of one another.
In our example above, the correlation between the monthly returns of XIC and the market factor is very close to 1, which is what you would expect from an index fund tracking the whole market. The close-to-zero figures for the value and size factors indicate these have no meaningful effect on the fund’s performance. During periods when value or small-cap stocks outperform or lag, the effect on XIC would be negligible.
The bottom row, labeled Alpha, is the portion of the fund’s performance that is not explained by the three factors. If an active fund manager added excess returns (or caused some underperformance), that would show up here as a positive number. But so would dumb luck—remember, alpha indicates outperformance or underperformance, but it doesn’t explain what caused it. In the case of an index fund like XIC, you should expect a slightly negative alpha because of the management fee.
The last column (t-stat) helps you determine whether the results are meaningful. As a rule of thumb, a t-stat higher than 2 or lower than –2 indicates the coefficient is statistically significant. A number closer to zero means it could just be noise. In this example, we can see the market and size coefficients are significant, while the value and alpha factors are less reliable.
I realize all this is rather technical, but bear with me during my next couple of posts, because it’s all heading toward some interesting findings. Later this week I’ll look at two traditional ETFs with added exposure to the value and small-cap factors. Then we’ll look at some other popular Canadian equity ETFs to see what’s driving their performance.
Note: Thanks to Justin Bender of PWL Capital for running these analyses, and to Andrea Frazzini of AQR Capital Management for supplying the data. I’d also like to thank Nathan Stretch, a long-time reader who pointed us to data sources and shared many of his own regression analyses with Justin and me. Nathan is the founder of Search Tempest and AutoTempest, which aggregate classified ads and automotive ads from multiple sources.
OK, let’s unpack all the jargon. The first key number is the R-squared, which tells you how well the data fit the model. In this case, a figure of 0.9949 indicates the three factors we’ve analyzed explain 99.49% of the performance of XIC. It’s an almost perfect fit.
Now look at the numbers in the “Coefficients” column. These are correlation coefficients, which measure the relationship between two variables—in this case, the fund’s monthly returns and each of the factors. A coefficient of +1 indicates the variables have perfect positive correlation: they move in the same direction by the same amount. A value of –1 indicates perfect negative (or inverse) correlation: the variables move in opposite directions. A value of zero means the variables move independently of one another.
In our example above, the correlation between the monthly returns of XIC and the market factor is very close to 1, which is what you would expect from an index fund tracking the whole market. The close-to-zero figures for the value and size factors indicate these have no meaningful effect on the fund’s performance. During periods when value or small-cap stocks outperform or lag, the effect on XIC would be negligible.
The bottom row, labeled Alpha, is the portion of the fund’s performance that is not explained by the three factors. If an active fund manager added excess returns (or caused some underperformance), that would show up here as a positive number. But so would dumb luck—remember, alpha indicates outperformance or underperformance, but it doesn’t explain what caused it. In the case of an index fund like XIC, you should expect a slightly negative alpha because of the management fee.
The last column (t-stat) helps you determine whether the results are meaningful. As a rule of thumb, a t-stat higher than 2 or lower than –2 indicates the coefficient is statistically significant. A number closer to zero means it could just be noise. In this example, we can see the market and size coefficients are significant, while the value and alpha factors are less reliable.
I realize all this is rather technical, but bear with me during my next couple of posts, because it’s all heading toward some interesting findings. Later this week I’ll look at two traditional ETFs with added exposure to the value and small-cap factors. Then we’ll look at some other popular Canadian equity ETFs to see what’s driving their performance.
Note: Thanks to Justin Bender of PWL Capital for running these analyses, and to Andrea Frazzini of AQR Capital Management for supplying the data. I’d also like to thank Nathan Stretch, a long-time reader who pointed us to data sources and shared many of his own regression analyses with Justin and me. Nathan is the founder of Search Tempest and AutoTempest, which aggregate classified ads and automotive ads from multiple sources.

Share this article Share on Facebook Share on Twitter Share on Linkedin Share on Reddit Share on Email