Worst investment ad of the year?
Here’s an ad arguing that skilled active managers can outperform their benchmark over the long term, and the “evidence” covers an absurdly short period and uses an entirely inappropriate benchmark.
Advertisement
Here’s an ad arguing that skilled active managers can outperform their benchmark over the long term, and the “evidence” covers an absurdly short period and uses an entirely inappropriate benchmark.
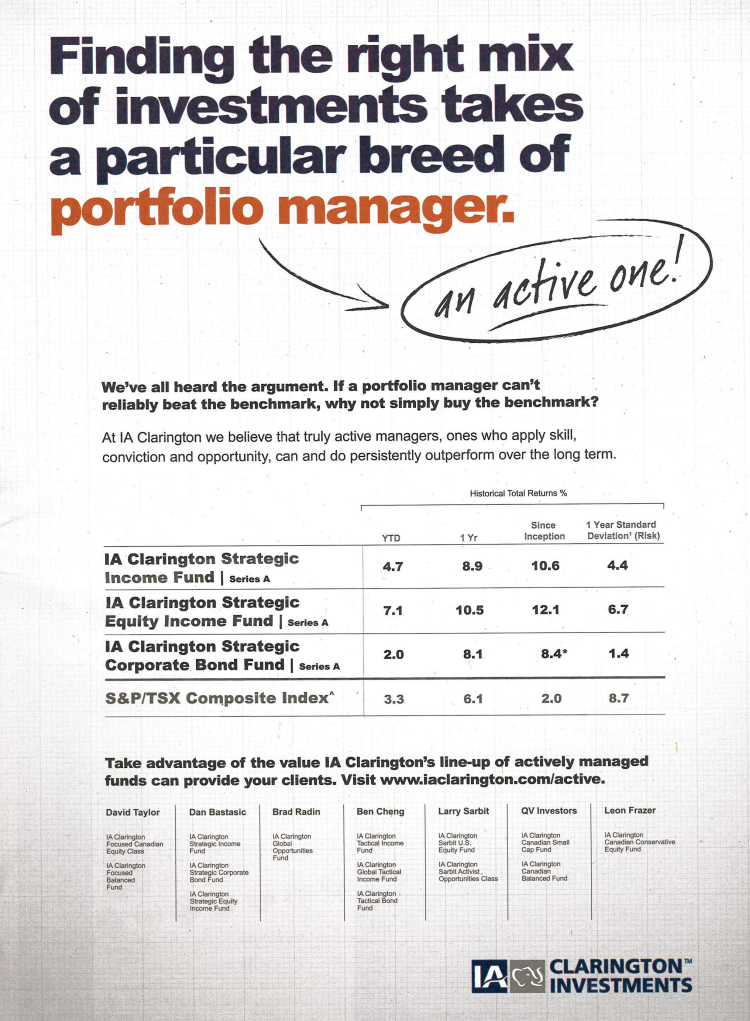 First there’s the time frame. The ad says the company believes active managers “can and do persistently outperform over the long-term.” But as explained in the fine print (microscope not provided), the year-to-date returns in the first column of the table are for the period ending March 31, so we’re talking about three months. We get 12-month returns in the second column, and the third column gives the funds’ returns since their inception. Problem is, the three funds spotlighted here were launched in the late summer of 2011, so they had been around for all of 18 to 19 months when these returns were calculated. That might be long-term if you’re an insect, but for the rest of us, it’s an utterly meaningless time frame for assessing investment returns.
But we’re just getting started. The funds’ returns are compared against the S&P/TSX Composite Index, the traditional benchmark for Canadian equity funds. But none of the funds in the ad fall into that category. The IA Clarington Strategic Equity Income Fund comes closest with 63% of its holdings in Canadian stocks, but it also includes 21% US stocks. The IA Clarington Strategic Income Fund is 38% Canadian equities, 14% US equities and 32% fixed income. Meanwhile, the IA Clarington Corporate Bond Fund includes precisely zero Canadian equities: it’s a high-yield bond fund. (The fine print does state that the benchmark index contains no fixed income, but acknowledging that doesn’t make the comparison any less worthless.)
So here’s an ad arguing that skilled active managers can outperform their benchmark over the long term, and the “evidence” covers an absurdly short period and uses an entirely inappropriate benchmark. It’s like they weren’t even trying.
What makes the ad even more outrageous is it appeared in an industry publication, so its target audience is advisors. We’re used to the fund industry holding retail investors in contempt, but one would hope even the dimmest advisor would see through such obviously fatuous claims.
First there’s the time frame. The ad says the company believes active managers “can and do persistently outperform over the long-term.” But as explained in the fine print (microscope not provided), the year-to-date returns in the first column of the table are for the period ending March 31, so we’re talking about three months. We get 12-month returns in the second column, and the third column gives the funds’ returns since their inception. Problem is, the three funds spotlighted here were launched in the late summer of 2011, so they had been around for all of 18 to 19 months when these returns were calculated. That might be long-term if you’re an insect, but for the rest of us, it’s an utterly meaningless time frame for assessing investment returns.
But we’re just getting started. The funds’ returns are compared against the S&P/TSX Composite Index, the traditional benchmark for Canadian equity funds. But none of the funds in the ad fall into that category. The IA Clarington Strategic Equity Income Fund comes closest with 63% of its holdings in Canadian stocks, but it also includes 21% US stocks. The IA Clarington Strategic Income Fund is 38% Canadian equities, 14% US equities and 32% fixed income. Meanwhile, the IA Clarington Corporate Bond Fund includes precisely zero Canadian equities: it’s a high-yield bond fund. (The fine print does state that the benchmark index contains no fixed income, but acknowledging that doesn’t make the comparison any less worthless.)
So here’s an ad arguing that skilled active managers can outperform their benchmark over the long term, and the “evidence” covers an absurdly short period and uses an entirely inappropriate benchmark. It’s like they weren’t even trying.
What makes the ad even more outrageous is it appeared in an industry publication, so its target audience is advisors. We’re used to the fund industry holding retail investors in contempt, but one would hope even the dimmest advisor would see through such obviously fatuous claims.
| 3-year | 5-year | 10-year | |
| IA Clarington Canadian Dividend A | 5.75 | 9.09 | 5.58 |
| IA Clarington Canadian Growth Series A | 2.03 | 8.52 | 5.10 |
| IA Clarington Canadian Leaders | –0.13 | 5.47 | 5.91 |
| IA Clarington Canadian Conservative Equity | 6.03 | 8.79 | 6.98 |
| iShares S&P/TSX Capped Composite (XIC) | 3.57 | 9.76 | 8.16 |
| Annualized returns as of November 8, 2013. Source: Morningstar | |||
Share this article Share on Facebook Share on Twitter Share on Linkedin Share on Reddit Share on Email