Don’t sweat the small asset allocation details
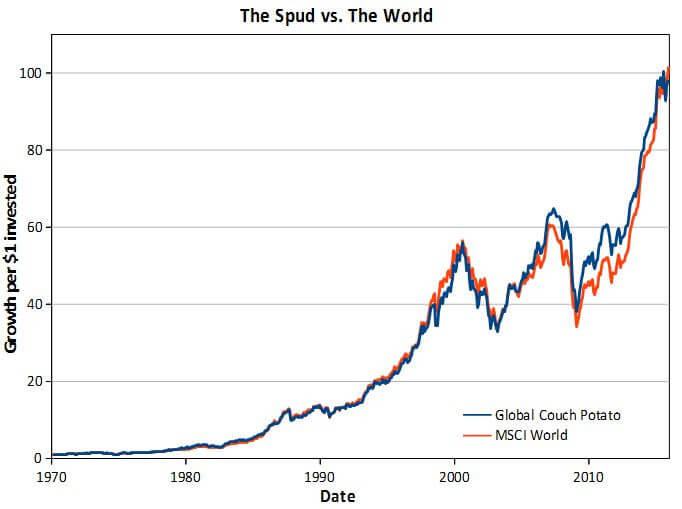
Two very opposing equity allocations haven't affected returns much over the decades
Advertisement
Two very opposing equity allocations haven't affected returns much over the decades
 The situation changes more noticeably if you look at the classic couch potato portfolio, which eliminates international stocks entirely. The graph below shows how it fares against the world index.
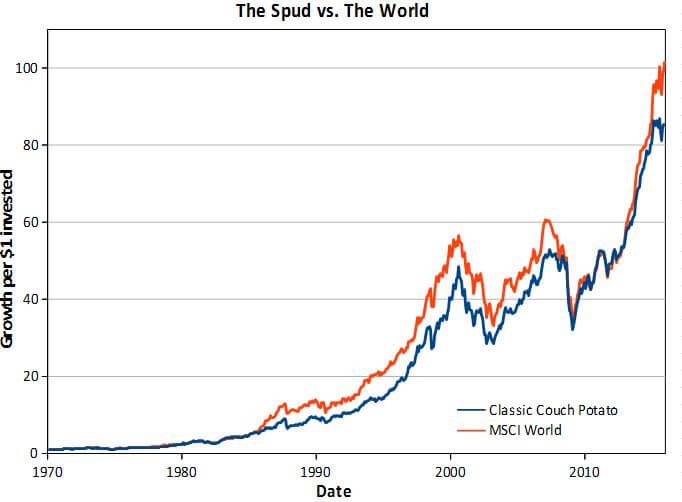 But even in this extreme instance, the returns between the two haven’t been too far off. For instance, in the early part of this decade the classic couch potato was basically running neck and neck with the world index.
I prefer the global variant of the global couch potato, which is more diversified than the classic version. But, based on past history, you probably shouldn’t worry too much if you have, say, an extra 5% devoted to Canadian stocks and proportionately less in U.S. and international stocks.
But even in this extreme instance, the returns between the two haven’t been too far off. For instance, in the early part of this decade the classic couch potato was basically running neck and neck with the world index.
I prefer the global variant of the global couch potato, which is more diversified than the classic version. But, based on past history, you probably shouldn’t worry too much if you have, say, an extra 5% devoted to Canadian stocks and proportionately less in U.S. and international stocks.
| Name | Price | P/B | P/E | Earnings Yield | Dividend Yield |
|---|---|---|---|---|---|
| National Bank (NA) | $42.68 | 1.54 | 10.49 | 9.54% | 5.06% |
| CIBC (CM) | $96.87 | 1.84 | 10.72 | 9.33% | 4.87% |
| Shaw (SJR.B) | $25.01 | 2.27 | 14.21 | 7.04% | 4.74% |
| Bank of Nova Scotia (BNS) | $62.48 | 1.48 | 10.79 | 9.27% | 4.61% |
| BCE (BCE) | $59.85 | 3.98 | 20.08 | 4.98% | 4.56% |
| Royal Bank (RY) | $74.76 | 1.76 | 11.21 | 8.92% | 4.33% |
| Bank of Montreal (BMO) | $78.67 | 1.32 | 11.71 | 8.54% | 4.27% |
| Power (POW) | $29.73 | 1.05 | 7.71 | 12.97% | 4.19% |
| TELUS (T) | $42.07 | 3.26 | 18.37 | 5.44% | 4.18% |
| Manulife (MFC) | $17.99 | 0.92 | 16.97 | 5.89% | 4.11% |
Share this article Share on Facebook Share on Twitter Share on Linkedin Share on Reddit Share on Email

Which ETFs should you invest in? Which ones best suit your risk tolerance? What about personal ethics? Check out...

Prediction markets are booming, but critics warn they can resemble gambling. Here's what investors need to know before trying...

Markets keep climbing despite economic headwinds. Allan Small explains why AI is driving growth and how investors can benefit...

The right cash allocation depends on your goals and stage of life. Here's how to think about cash in...

Reitmans narrowed its quarterly loss and Empire raised its dividend, but investors sent Groupe Dynamite and Gildan shares sharply...

Investors seeking cash flow from real assets and inflation resistance should consider these infrastructure ETFs.

Find the best GIC rates in Canada. Plus, everything you need to know about how they work.

Robinhood’s WonderFi acquisition closes as Shopify adds US$3 billion to its buyback plan and Apotex targets a $1-billion IPO.

Leaving a TFSA to a U.S. spouse can trigger complex IRS reporting and costly tax issues. Here’s why some...