Can you build a 40/30/30 portfolio with ETFs?
This more sophisticated alternative to the 60/40 portfolio promises to avoid down years like 2022. Is it achievable for DIY investors? Yes, with caveats.
Advertisement
This more sophisticated alternative to the 60/40 portfolio promises to avoid down years like 2022. Is it achievable for DIY investors? Yes, with caveats.

The unique market conditions of the 2022 bear market exposed a major flaw in the traditional 60% stocks/40% bonds balanced portfolio used by millions of investors. That year was defined by two forces: surging inflation across both the U.S. and Canada, and aggressive interest rate hikes by their respective central banks.
From January to December 2022, the Vanguard Balanced ETF Portfolio (VBAL), which holds a 60/40 mix, lost 15.04%, nearly as much as the 16.88% decline posted by the 100%-stocks Vanguard All-Equity ETF Portfolio (VEQT). The problem wasn’t the stocks; investors should expect volatility with them. It was the bonds.
| Portfolio Analysis Results (Jan 2022 – Dec 2022) | ||
| Metric | Vanguard All-Equity ETF Portfolio (VEQT) | Vanguard Balanced ETF Portfolio (VBAL) |
| Start balance | $10,000 | $10,000 |
| End balance | $8,921 | $8,859 |
| Annualized return (CAGR) | -10.79% | -11.41% |
| Standard deviation | 15.96% | 11.96% |
| Maximum drawdown | -16.88% | -15.04% |
| Sharpe ratio | -0.78 | -1.15 |
| Sortino ratio | -1.02 | -1.40 |
As interest rates spiked to combat inflation, the bond component of VBAL was hit hard. Its higher-than-average intermediate duration (a measure of rate sensitivity) meant that prices fell more sharply than shorter-term bond holdings might have. This caught many conservative investors off guard, particularly those who believed fixed income would provide ballast in a downturn.
In response, many portfolio strategists began proposing a new model: the 40/30/30. That’s 40% equities, 30% bonds, and 30% alternatives.
While institutions and advisors have access to sophisticated private alternatives to make this work, the question is whether Canadian retail investors can replicate a similar structure using publicly listed ETFs. Here’s my take, and some suggested ETFs to obtain exposure to the alternative space.
The 40/30/30 portfolio is a conceptual framework that modifies the traditional balanced portfolio by carving out space for alternative assets. The idea is to introduce a third asset class that behaves differently from the other two.
In periods like 2022, when both stocks and bonds declined together due to rising inflation and interest rates, traditional diversification strategies failed. The extra alternatives sleeve is designed to preserve capital in times when the other two pillars of a portfolio move in tandem.
It’s not a one-size-fits-all prescription. The 30% allocated to alternatives can vary widely depending on the portfolio manager’s preferences. In most institutional and advisor-led implementations, that portion could include:
It’s hard to draw firm conclusions because two factors limit the usefulness of most data used to support the 40/30/30 thesis.
The first is survivorship bias. It’s easy to look backward and identify strategies that delivered low correlation and solid returns, but that’s hindsight. Investors didn’t necessarily have access to these funds or conviction in them when it mattered most. The danger is cherry-picking success stories that weren’t widely known or available at the time.
Second, results are highly time-period dependent. The performance of any diversified strategy can vary meaningfully depending on the start and end dates. A few good or bad years in alternatives can drastically skew the overall return and risk profile of a portfolio.
That said, there is a relatively robust benchmark with over two decades of data that helps assess the viability of the concept: the MLM Index. This benchmark tracks a systematic trend-following strategy across 11 commodities, six currencies, and five global bond futures markets. It weights each category based on historical volatility and equal-weights individual contracts within each basket. While not a perfect proxy for all alternatives, it offers rare long-term, transparent, and rule-based data in a space often lacking both.
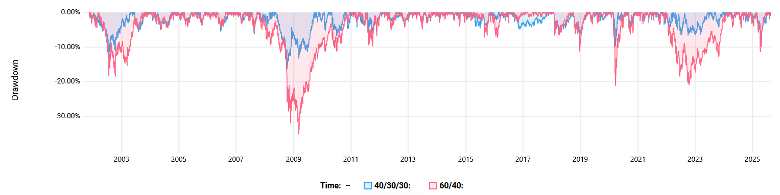
Using data from Nov. 12, 2001, through Aug. 19, 2025, a 40/30/30 portfolio built with the S&P 500, Bloomberg U.S. Aggregate Bond Index, and KFA MLM Index (rebalanced quarterly) underperformed a traditional 60/40 mix on total returns, with a 6.89% compound annual growth rate (CAGR) versus 7.46%. However, it significantly outperformed on a risk-adjusted basis, with a Sharpe ratio of 0.71 versus 0.56.
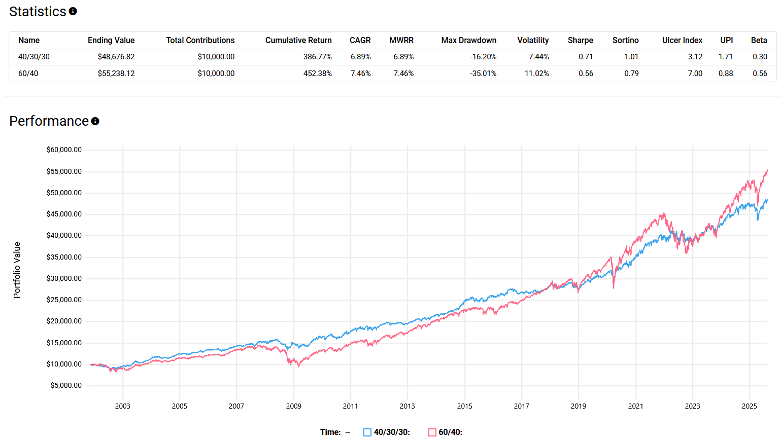
More importantly, the diversification benefit showed up when it mattered. The 40/30/30 portfolio demonstrated better downside protection during key stress events like the bursting of the dot-com bubble, the 2008 financial crisis, the COVID-19 crash in 2020 and the bear market of 2022.
Investors can access the KFA MLM Index through a U.S.-listed ETF: the KraneShares Mount Lucas Managed Futures Index Strategy ETF (KMLM). It directly tracks the benchmark and provides exposure to trend-following futures strategies across commodities, currencies and fixed income.
The catch? Since KMLM is U.S.-listed, Canadians face a few hurdles: currency conversion, a high 0.90% management expense ratio, and a 15% foreign withholding tax on distributions unless it’s held in a registered retirement savings plan (RRSP).
In Canada, alternative strategies are also allowed under National Instrument 81-102, and there’s a growing list of ETFs that attempt to fill this role. Using the Cboe Canada ETF screener and filtering for “alternative” as the asset class turns up about 20 products. These are highly provider-specific and differ in strategy, structure, and effectiveness.
One of the more accessible options is the NBI Liquid Alternatives ETF (NALT), which uses a quantitative model to take long and short positions across equity, bond, commodity, and currency futures. It aims to provide positive returns with low correlation to equity markets. NALT’s management expense ratio is relatively modest for an alt fund at 0.64%, but its 0.26% average bid-ask spread reflects limited liquidity.
NALT delivered what it promised in 2022, returning 8.58% during a down year for traditional portfolios. But it’s been negative in 2023, 2024, and so far in 2025. That illustrates one key risk of alternatives: they often shine during market stress, but can underperform when conditions normalize. Investors who chase past performance may end up fighting the last battle.
Another Canadian-listed option that held up well during the 2022 drawdown is the Picton Mahoney Fortified Market Neutral Alternative Fund (PFMN). This fund employs a market-neutral strategy that aims for zero market beta by balancing long and short positions in Canadian and U.S. equities. The idea is that performance is based on security selection rather than broad market direction.
PFMN returned 5.68% in 2022 with relatively low volatility and followed up with positive returns in both 2023 and 2024 as well as year-to-date in 2025. The downside is its hedge-fund-like fee structure. It charges a 0.95% base fee on assets, plus a 20% performance fee over a 2% hurdle using a perpetual high-water mark. That means the manager only earns performance fees (on the excess return) if returns surpass the fund’s previous peak.
It wasn’t hard for me to identify two reasonable options among Canadian alternative ETFs, which itself highlights a key concern: there just aren’t that many strong choices yet. The alternative ETF space here is still young, and manager-specific risk is high.
Many of these strategies depend entirely on the skill, discipline, and consistency of a specific investment team or a proprietary, black-box-like model. Style drift, where managers gradually change their approach or algorithm, is another concern, particularly in strategies where transparency is limited.
In short, the 40/30/30 portfolio can work. It may offer better risk-adjusted returns during market stress, and it can be built using either U.S. or Canadian ETFs.
But this assumes you’re comfortable with higher fees, the complexity of implementation, and the fact that these strategies may underperform during bull markets. It also means trusting specific managers, which makes due diligence all the more important. After all that, you may conclude you’re better off over the long term—2022 was just one year, after all—sticking with 60/40.
Share this article Share on Facebook Share on Twitter Share on Linkedin Share on Reddit Share on Email

A U.S.-Iran ceasefire has eased oil prices and inflation fears. Here's what that could mean for bitcoin prices and...

The right cash allocation depends on your goals and stage of life. Here's how to think about cash in...

Investors seeking cash flow from real assets and inflation resistance should consider these infrastructure ETFs.

Artificial intelligence is best at overcoming the friction that stops you from taking up new pursuits, users insist.

Learn how RDSP withdrawals work, including the 10-year rule, grant repayment requirements, taxes, and mandatory withdrawals after age 60.

The GST quick method can simplify tax reporting for small businesses—but it’s not right for everyone. Here’s who qualifies...

Could moving your RRIF into segregated funds lower estate taxes? Maybe—but higher fees and other trade-offs could leave your...

Changes to Canada’s Disability Tax Credit will make it easier to qualify, reduce CRA red tape, and expand access...

You might be missing valuable tax credits, deductions, and filing opportunities. Here are nine ways to maximize your tax...

We check in on some champions of early retirement nearing their own finish line of financial independence.
Too funny, We don’t need expensive private assets. Real assets will do the trick.
I put the Purpose Real Asset ETF (PRA-T) on the table many years ago on MoneySense. For use in a Couch Potato Portfolio if you want added inflation protection.
It was up 16% in 2022.
It’s a Canadian Dollar ETF.
Simple works.
Part of