Where to buy real estate in 2019: Metro Toronto
With large yards, parking and homes that are just steps from an inner-city ravine system, Rockcliffe-Smythe is our No. 1 Toronto neighbourhood pick.
Advertisement
With large yards, parking and homes that are just steps from an inner-city ravine system, Rockcliffe-Smythe is our No. 1 Toronto neighbourhood pick.
| Rank | Neighbourhood | Area | Average home price (2017) | Value | Momentum | Average price vs. area | Avg. price vs. metro district | Avg. price vs. outer region | 1-year price change | 5-year price change | Final Star Rating |
|---|---|---|---|---|---|---|---|---|---|---|---|
| 1 | Rockcliffe-Smythe | Toronto W03 | $723,575 | 77.24% | 83.77% | 97.7% | 63.03% | 77.7% | 6.71% | 79.0% | ★★★★ |
| 2 | Humber Summit | Toronto W05 | $706,722 | 84.89% | 75.00% | 94.2% | 60.81% | 75.0% | -4.97% | 133.4% | ★★★★ |
| 3 | Glenfield-Jane Heights | Toronto W05 | $745,701 | 88.99% | 80.78% | 92.0% | 59.39% | 73.3% | -3.66% | 168.6% | ★★★★ |
| 4 | Keelesdale-Eglinton West | Toronto W03 | $1,204,201 | 78.54% | 78.73% | 97.1% | 62.67% | 77.3% | 7.14% | 71.8% | ★★★★ |
| 5 | Little Portugal | Toronto C01 | $916,466 | 48.13% | 87.13% | 89.3% | 101.20% | 124.8% | 1.39% | 186.1% | ★★★★ |
| 6 | Oakwood-Vaughan | Toronto C03 | $615,053 | 72.57% | 73.69% | 51.4% | 77.02% | 95.0% | 7.70% | 71.1% | ★★★½ |
| 7 | Mount Dennis | Toronto W04 | $1,306,366 | 99.07% | 57.09% | 68.0% | 51.69% | 63.8% | -1.51% | 61.0% | ★★★½ |
| 8 | Kensington-Chinatown | Toronto C01 | $701,448 | 37.87% | 95.52% | 96.8% | 109.78% | 135.4% | 9.62% | 473.2% | ★★★½ |
| 9 | Oakridge | Toronto E06 | $712,802 | 93.47% | 64.55% | 86.8% | 58.95% | 72.7% | -4.68% | 74.4% | ★★★½ |
| 10 | Black Creek | Toronto W05 | $730,270 | 87.50% | 67.72% | 92.8% | 59.90% | 73.9% | 4.55% | 59.1% | ★★★½ |
| 11 | West Hill | Toronto E10 | $864,733 | 87.31% | 60.07% | 88.3% | 61.37% | 75.7% | 8.42% | 57.2% | ★★★½ |
| 12 | Caledonia-Fairbank | Toronto W03 | $874,039 | 60.82% | 89.18% | 112.6% | 72.67% | 89.6% | 9.95% | 85.6% | ★★★½ |
| 13 | Woodbine-Lumsden | Toronto E03 | $886,913 | 74.63% | 61.19% | 86.2% | 73.45% | 90.6% | 1.02% | 65.1% | ★★★½ |
| 14 | Briar Hill-Belgravia | Toronto W04 | $1,353,253 | 64.55% | 78.36% | 98.1% | 74.53% | 91.9% | -0.42% | 83.1% | ★★★½ |
| 15 | Dufferin Grove | Toronto C01 | $731,473 | 32.28% | 98.69% | 100.3% | 113.72% | 140.3% | 14.72% | 512.7% | ★★★½ |
| 16 | Weston | Toronto W04 | $729,035 | 88.99% | 58.21% | 80.9% | 61.47% | 75.8% | 0.80% | 61.9% | ★★★½ |
| 17 | Woburn | Toronto E09 | $746,787 | 81.34% | 64.18% | 99.9% | 61.27% | 75.6% | 2.84% | 65.9% | ★★★½ |
| 18 | Mount Olive-Silverstone-Jamestown | Toronto W10 | $702,736 | 73.13% | 81.90% | 106.3% | 62.76% | 77.4% | 8.63% | 74.0% | ★★★½ |
| 19 | Humbermede | Toronto W05 | $772,315 | 89.93% | 61.38% | 91.5% | 59.06% | 72.8% | -1.87% | 82.7% | ★★★½ |
| 20 | Eglinton East | Toronto E08 | $631,198 | 83.77% | 58.77% | 84.3% | 64.90% | 80.1% | 0.24% | 65.6% | ★★★½ |
| 21 | Malvern | Toronto E11 | $692,097 | 91.60% | 54.48% | 92.3% | 53.04% | 65.4% | -0.33% | 61.4% | ★★★½ |
| 22 | Kennedy Park | Toronto E04 | $729,499 | 91.42% | 41.98% | 91.5% | 58.16% | 71.7% | -1.65% | 56.0% | ★★★½ |
| 23 | Rexdale-Kipling | Toronto W10 | $813,832 | 78.17% | 73.69% | 103.9% | 61.31% | 75.6% | 2.91% | 69.4% | ★★★½ |
| 24 | Humberlea-Pelmo Park W4 | Toronto W04 | $742,644 | 77.61% | 69.78% | 90.0% | 68.39% | 84.4% | -5.68% | 91.7% | ★★★½ |
| 25 | Elms-Old Rexdale | Toronto W10 | $730,011 | 75.19% | 74.07% | 105.8% | 62.41% | 77.0% | 8.70% | 65.2% | ★★★½ |
| 26 | Crescent Town | Toronto E03 | $1,279,511 | 91.23% | 40.86% | 72.0% | 61.35% | 75.7% | -4.26% | 52.4% | ★★★½ |
| 27 | Moss Park | Toronto C08 | $1,306,424 | 38.06% | 83.40% | 101.0% | 107.53% | 132.6% | 17.07% | 433.1% | ★★★½ |
| 28 | Cabbagetown-South St. James Town | Toronto C08 | $768,813 | 34.14% | 79.29% | 103.1% | 109.79% | 135.4% | -4.84% | 240.8% | ★★★½ |
| 29 | West Humber-Clairville | Toronto W10 | $1,391,603 | 70.15% | 80.60% | 109.5% | 64.61% | 79.7% | 10.61% | 67.4% | ★★★½ |
| 30 | South Parkdale | Toronto W01 | $787,442 | 27.99% | 94.40% | 104.3% | 116.95% | 144.2% | 13.42% | 228.3% | ★★★½ |
| 31 | Clairlea-Birchmount | Toronto E04 | $966,748 | 70.15% | 64.93% | 104.1% | 66.17% | 81.6% | 2.71% | 66.8% | ★★★½ |
| 32 | Mimico | Toronto W06 | $1,098,825 | 51.49% | 76.68% | 102.4% | 81.24% | 100.2% | 4.87% | 77.3% | ★★★½ |
| 33 | East York | Toronto E03 | $968,126 | 40.49% | 80.60% | 108.3% | 92.34% | 113.9% | 10.23% | 76.6% | ★★★½ |
| 34 | Danforth Village-East York | Toronto E03 | $913,862 | 54.29% | 53.54% | 95.5% | 81.36% | 100.4% | 2.18% | 60.8% | ★★★½ |
| 35 | Rouge E10 | Toronto E10 | $1,507,003 | 55.41% | 62.69% | 110.5% | 76.80% | 94.7% | 2.79% | 63.8% | ★★★½ |
| 36 | Palmerston-Little Italy | Toronto C01 | $778,635 | 22.20% | 81.34% | 111.7% | 126.65% | 156.2% | -1.47% | 131.5% | ★★★½ |
| 37 | Thistletown-Beaumonde Heights | Toronto W10 | $721,620 | 67.72% | 67.16% | 110.9% | 65.43% | 80.7% | 6.69% | 65.9% | ★★★½ |
| 38 | Weston-Pellam Park | Toronto W03 | $874,229 | 86.19% | 47.39% | 94.0% | 60.64% | 74.8% | -2.11% | 59.3% | ★★★½ |
| 39 | Beechborough-Greenbrook | Toronto W04 | $915,568 | 66.60% | 66.23% | 96.7% | 73.47% | 90.6% | -19.28% | 117.4% | ★★★½ |
| 40 | Etobicoke West Mall | Toronto W08 | $744,769 | 72.01% | 47.20% | 69.4% | 76.94% | 94.9% | -3.81% | 55.5% | ★★★½ |
| 41 | Bendale | Toronto E09 | $1,480,988 | 76.87% | 49.44% | 102.0% | 62.59% | 77.2% | 3.32% | 56.2% | ★★★ |
| 42 | Trinity-Bellwoods | Toronto C01 | $700,204 | 23.88% | 75.00% | 109.8% | 124.46% | 153.5% | 3.86% | 298.9% | ★★★ |
| 43 | Ionview | Toronto E04 | $1,150,535 | 89.93% | 27.05% | 92.6% | 58.84% | 72.6% | -5.38% | 46.2% | ★★★ |
| 44 | Regent Park | Toronto C08 | $875,511 | 49.63% | 50.19% | 90.8% | 96.69% | 119.3% | -2.84% | 58.7% | ★★★ |
| 45 | Greenwood-Coxwell | Toronto E01 | $889,193 | 75.00% | 28.73% | 78.1% | 73.58% | 90.8% | -3.98% | 47.9% | ★★★ |
| 46 | New Toronto | Toronto W06 | $1,596,098 | 66.23% | 56.72% | 94.2% | 74.73% | 92.2% | -6.33% | 62.8% | ★★★ |
| 47 | Englemount-Lawrence | Toronto C04 | $971,303 | 36.57% | 72.57% | 80.1% | 134.13% | 165.4% | -0.82% | 79.1% | ★★★ |
| 48 | Alderwood | Toronto W06 | $873,114 | 49.07% | 70.15% | 102.9% | 81.63% | 100.7% | 6.30% | 65.1% | ★★★ |
| 49 | Blake-Jones | Toronto E01 | $975,044 | 77.99% | 25.93% | 77.9% | 73.37% | 90.5% | -14.16% | 28.8% | ★★★ |
| 50 | O'Connor-Parkview | Toronto E03 | $1,005,905 | 51.68% | 58.21% | 96.1% | 81.94% | 101.1% | 5.69% | 60.5% | ★★★ |
| 51 | Cliffcrest | Toronto E08 | $984,244 | 42.54% | 72.39% | 109.8% | 84.53% | 104.3% | 7.68% | 71.5% | ★★★ |
| 52 | Birchcliffe-Cliffside | Toronto E06 | $725,980 | 39.37% | 78.92% | 121.8% | 82.71% | 102.0% | 16.60% | 66.4% | ★★★ |
| 53 | Morningside | Toronto E09 | $1,201,571 | 82.28% | 37.13% | 99.5% | 61.01% | 75.3% | -7.83% | 56.7% | ★★★ |
| 54 | Yorkdale-Glen Park | Toronto W04 | $940,929 | 30.22% | 76.31% | 132.9% | 100.98% | 124.5% | -0.47% | 83.1% | ★★★ |
| 55 | Eringate-Centennial-West Deane | Toronto W08 | $1,616,335 | 66.79% | 50.56% | 71.3% | 79.07% | 97.5% | 6.91% | 49.2% | ★★★ |
| 56 | University | Toronto C01 | $1,282,144 | 16.98% | 90.49% | 119.8% | 135.83% | 167.5% | 3.24% | 495.3% | ★★★ |
| 57 | Bathurst Manor | Toronto C06 | $933,915 | 46.08% | 58.77% | 87.9% | 107.75% | 132.9% | -8.66% | 68.8% | ★★★ |
| 58 | Rustic | Toronto W04 | $936,804 | 55.60% | 71.08% | 103.3% | 78.48% | 96.8% | 0.64% | 102.7% | ★★★ |
| 59 | Woodbine Corridor | Toronto E02 | $1,322,692 | 65.86% | 34.70% | 85.6% | 78.73% | 97.1% | -3.61% | 48.2% | ★★★ |
| 60 | Islington-City Centre West | Toronto W08 | $1,064,529 | 34.14% | 70.71% | 100.3% | 111.16% | 137.1% | 14.44% | 61.2% | ★★★ |
| 61 | Long Branch | Toronto W06 | $1,575,584 | 39.37% | 65.49% | 112.7% | 89.46% | 110.3% | 0.90% | 73.9% | ★★★ |
| 62 | Humewood-Cedarvale | Toronto C03 | $924,255 | 34.51% | 65.67% | 88.3% | 132.41% | 163.3% | 10.49% | 60.5% | ★★★ |
| 63 | Kingsview Village-The Westway | Toronto W09 | $2,162,519 | 59.14% | 49.07% | 99.9% | 77.67% | 95.8% | 1.68% | 57.5% | ★★★ |
| 64 | Annex | Toronto C02 | $2,115,505 | 14.55% | 63.81% | 106.9% | 181.73% | 224.2% | 11.64% | 49.1% | ★★★ |
| 65 | Forest Hill North | Toronto C04 | $835,467 | 15.67% | 64.55% | 106.1% | 177.78% | 219.3% | 13.88% | 59.9% | ★★★ |
| 66 | Humberlea-Pelmo Park W5 | Toronto W05 | $761,846 | 64.37% | 48.32% | 108.8% | 70.21% | 86.6% | -0.70% | 52.7% | ★★★ |
| 67 | Wexford-Maryvale | Toronto E04 | $874,045 | 75.19% | 34.33% | 100.7% | 64.02% | 79.0% | -9.05% | 55.8% | ★★★ |
| 68 | Corso Italia-Davenport | Toronto W03 | $918,131 | 58.02% | 36.38% | 113.8% | 73.45% | 90.6% | -3.11% | 48.1% | ★★★ |
| 69 | East End-Danforth | Toronto E02 | $1,207,792 | 68.84% | 18.66% | 83.9% | 77.16% | 95.2% | -4.79% | 34.3% | ★★★ |
| 70 | Runnymede-Bloor West Village | Toronto W02 | $1,465,100 | 34.51% | 46.46% | 110.7% | 101.50% | 125.2% | 3.96% | 49.5% | ★★★ |
| 71 | Henry Farm | Toronto C15 | $2,503,258 | 28.92% | 63.81% | 101.0% | 123.12% | 151.9% | -8.89% | 73.7% | ★★★ |
| 72 | Bedford Park-Nortown | Toronto C04 | $908,743 | 6.53% | 77.24% | 125.6% | 210.37% | 259.5% | 6.68% | 71.9% | ★★★ |
| 73 | Centennial Scarborough | Toronto E10 | $959,693 | 57.28% | 47.76% | 109.8% | 76.37% | 94.2% | 1.15% | 52.0% | ★★★ |
| 74 | Willowridge-Martingrove-Richview | Toronto W09 | $818,679 | 50.93% | 56.72% | 103.7% | 80.65% | 99.5% | 12.89% | 49.5% | ★★★ |
| 75 | Brookhaven-Amesbury | Toronto W04 | $950,569 | 76.87% | 23.88% | 90.5% | 68.80% | 84.9% | -2.56% | 34.4% | ★★★ |
| 76 | Dovercourt-Wallace Emerson-Junction | Toronto W02 | $1,909,055 | 63.06% | 24.44% | 87.1% | 79.88% | 98.5% | -4.85% | 40.1% | ★★★ |
| 77 | Newtonbrook East | Toronto C14 | $1,283,280 | 25.19% | 65.67% | 93.1% | 160.43% | 197.9% | -10.89% | 77.6% | ★★★ |
| 78 | Stonegate-Queensway | Toronto W07 | $822,992 | 29.10% | 73.88% | 118.3% | 107.84% | 133.0% | 18.27% | 62.0% | ★★★ |
| 79 | York University Heights | Toronto W05 | $2,621,947 | 65.86% | 27.99% | 107.2% | 69.16% | 85.3% | -4.50% | 45.1% | ★★★ |
| 80 | Bayview Village | Toronto C15 | $2,664,929 | 3.73% | 81.53% | 180.8% | 220.34% | 271.8% | 0.22% | 96.9% | ★★★ |
| 81 | Yonge-St. Clair | Toronto C02 | $938,422 | 4.10% | 68.10% | 131.8% | 223.95% | 276.2% | 9.57% | 61.5% | ★★★ |
| 82 | Highland Creek | Toronto E10 | $1,377,618 | 49.25% | 38.25% | 113.4% | 78.86% | 97.3% | -10.69% | 53.7% | ★★★ |
| 83 | Newtonbrook West | Toronto C07 | $848,109 | 38.06% | 48.32% | 89.8% | 115.77% | 142.8% | 3.77% | 59.3% | ★★★ |
| 84 | Guildwood | Toronto E08 | $987,603 | 72.76% | 27.05% | 92.5% | 71.27% | 87.9% | -7.38% | 46.2% | ★★★ |
| 85 | Maple Leaf | Toronto W04 | $908,986 | 43.47% | 33.96% | 109.2% | 83.00% | 102.4% | -9.44% | 45.9% | ★★★ |
| 86 | Steeles | Toronto E05 | $806,554 | 65.86% | 12.13% | 93.4% | 76.39% | 94.2% | -8.78% | 34.3% | ★★★ |
| 87 | Downsview-Roding-CFB | Toronto W05 | $1,234,296 | 68.66% | 39.18% | 105.0% | 67.78% | 83.6% | 6.66% | 40.7% | ★★★ |
| 88 | Roncesvalles | Toronto W01 | $2,099,546 | 43.84% | 24.63% | 92.5% | 103.73% | 127.9% | -0.35% | 35.3% | ★★★ |
| 89 | Kingsway South | Toronto W08 | $1,016,076 | 7.84% | 83.96% | 159.2% | 176.44% | 217.6% | 14.20% | 71.4% | ★★★ |
| 90 | South Riverdale | Toronto E01 | $933,688 | 53.17% | 21.08% | 90.7% | 85.39% | 105.3% | -6.10% | 42.7% | ★★★ |
| 91 | L'Amoreaux | Toronto E05 | $784,794 | 60.26% | 27.05% | 95.9% | 78.46% | 96.8% | -1.25% | 40.6% | ★★★ |
| 92 | Rouge E11 | Toronto E11 | $832,235 | 65.67% | 30.04% | 114.8% | 65.95% | 81.3% | 5.82% | 35.6% | ★★★ |
| 93 | Milliken | Toronto E07 | $3,378,544 | 72.20% | 27.43% | 94.2% | 69.94% | 86.3% | 0.71% | 39.5% | ★★★ |
| 94 | St. Andrew-Windfields | Toronto C12 | $806,087 | 24.44% | 62.13% | 78.7% | 283.92% | 350.2% | -2.16% | 65.4% | ★★★ |
| 95 | Agincourt North | Toronto E07 | $873,976 | 77.80% | 13.81% | 91.2% | 67.74% | 83.6% | -6.42% | 33.5% | ★★½ |
| 96 | Tam O'Shanter-Sullivan | Toronto E05 | $1,325,612 | 73.51% | 18.66% | 89.8% | 73.45% | 90.6% | -11.14% | 39.4% | ★★½ |
| 97 | Wychwood | Toronto C02 | $2,300,349 | 45.90% | 22.20% | 65.6% | 111.40% | 137.4% | 2.11% | 30.3% | ★★½ |
| 98 | Willowdale East | Toronto C14 | $1,773,134 | 11.19% | 68.28% | 112.1% | 193.32% | 238.4% | 14.68% | 65.2% | ★★½ |
| 99 | Willowdale West | Toronto C07 | $968,178 | 14.93% | 61.57% | 115.6% | 149.01% | 183.8% | -5.73% | 76.2% | ★★½ |
| 100 | Junction Area | Toronto W02 | $969,265 | 58.96% | 16.04% | 88.7% | 81.36% | 100.4% | -0.33% | 25.8% | ★★½ |
| 101 | Victoria Village | Toronto C13 | $909,570 | 62.87% | 21.64% | 67.6% | 81.45% | 100.5% | -12.90% | 42.3% | ★★½ |
| 102 | Broadview North | Toronto E03 | $1,426,676 | 68.66% | 3.36% | 89.7% | 76.44% | 94.3% | -13.34% | 19.4% | ★★½ |
| 103 | Clanton Park | Toronto C06 | $1,066,035 | 31.16% | 42.16% | 97.8% | 119.89% | 147.9% | -5.74% | 51.8% | ★★½ |
| 104 | Hillcrest Village | Toronto C15 | $1,220,567 | 56.90% | 9.14% | 73.5% | 89.59% | 110.5% | -10.44% | 33.8% | ★★½ |
| 105 | Parkwoods-Donalda | Toronto C13 | $1,902,021 | 48.69% | 26.87% | 85.1% | 102.57% | 126.5% | 0.59% | 38.9% | ★★½ |
| 106 | Lansing-Westgate | Toronto C07 | $1,685,373 | 11.94% | 61.38% | 124.0% | 159.84% | 197.2% | -0.86% | 62.8% | ★★½ |
| 107 | High Park-Swansea | Toronto W01 | $954,582 | 14.18% | 62.50% | 126.3% | 141.63% | 174.7% | 8.94% | 58.5% | ★★½ |
| 108 | Danforth | Toronto E03 | $1,186,697 | 57.46% | 5.60% | 94.1% | 80.22% | 98.9% | -10.84% | 27.2% | ★★½ |
| 109 | Don Valley Village | Toronto C15 | $1,069,615 | 52.43% | 24.63% | 81.8% | 99.73% | 123.0% | -15.31% | 48.6% | ★★½ |
| 110 | Scarborough Village | Toronto E08 | $1,338,629 | 37.13% | 32.28% | 116.7% | 89.89% | 110.9% | -6.71% | 44.5% | ★★½ |
| 111 | Lambton Baby Point | Toronto W02 | $1,837,206 | 23.51% | 52.99% | 122.7% | 112.50% | 138.8% | 13.72% | 57.4% | ★★½ |
| 112 | Leaside | Toronto C11 | $1,287,180 | 15.86% | 33.40% | 111.9% | 154.39% | 190.4% | 11.86% | 28.3% | ★★½ |
| 113 | Playter Estates-Danforth | Toronto E03 | $3,287,905 | 26.31% | 29.10% | 126.9% | 108.17% | 133.4% | -3.86% | 25.2% | ★★½ |
| 114 | Rosedale-Moore Park | Toronto C09 | $1,700,179 | 5.60% | 68.47% | 119.9% | 276.31% | 340.8% | 19.90% | 63.3% | ★★½ |
| 115 | Yonge-Eglinton | Toronto C03 | $1,112,402 | 26.49% | 19.59% | 95.3% | 142.88% | 176.2% | -8.43% | 38.7% | ★★½ |
| 116 | Markland Wood | Toronto W08 | $977,718 | 53.36% | 25.56% | 84.3% | 93.48% | 115.3% | -11.53% | 42.6% | ★★½ |
| 117 | Westminster-Branson | Toronto C07 | $1,649,747 | 61.75% | 3.17% | 63.7% | 82.17% | 101.3% | -21.79% | 24.1% | ★★½ |
| 118 | Lawrence Park North | Toronto C04 | $940,485 | 34.89% | 17.35% | 82.8% | 138.64% | 171.0% | -2.49% | 31.3% | ★★½ |
| 119 | Agincourt South-Malvern West | Toronto E07 | $958,013 | 52.24% | 25.19% | 106.5% | 79.04% | 97.5% | -7.36% | 45.1% | ★★½ |
| 120 | Pleasant View | Toronto C15 | $1,707,152 | 65.86% | 4.85% | 66.1% | 80.51% | 99.3% | -12.84% | 27.8% | ★★½ |
| 121 | Mount Pleasant West | Toronto C10 | $1,553,112 | 21.64% | 22.76% | 103.2% | 143.46% | 177.0% | -2.42% | 31.8% | ★★½ |
| 122 | Mount Pleasant East | Toronto C10 | $1,516,934 | 30.97% | 20.71% | 93.8% | 130.52% | 161.0% | -2.68% | 35.0% | ★★½ |
| 123 | Princess-Rosethorn | Toronto W08 | $1,154,177 | 20.15% | 45.90% | 115.0% | 127.48% | 157.2% | 0.37% | 53.8% | ★★½ |
| 124 | North Riverdale | Toronto E01 | $1,321,537 | 41.60% | 0.75% | 103.0% | 96.99% | 119.6% | -27.05% | 2.8% | ★★½ |
| 125 | High Park North | Toronto W02 | $2,368,252 | 25.56% | 33.77% | 121.1% | 111.06% | 137.0% | 6.81% | 36.7% | ★★½ |
| 126 | Lawrence Park South | Toronto C04 | $1,374,148 | 8.77% | 23.88% | 118.8% | 199.02% | 245.5% | -10.16% | 44.1% | ★★½ |
| 127 | The Beaches | Toronto E02 | $2,012,771 | 21.83% | 21.83% | 125.5% | 115.48% | 142.4% | 4.55% | 28.2% | ★★ |
| 128 | Edenbridge-Humber Valley | Toronto W08 | $3,757,271 | 9.14% | 43.28% | 152.6% | 169.15% | 208.6% | -3.72% | 43.5% | ★★ |
| 129 | Forest Hill South | Toronto C03 | $1,319,395 | 1.31% | 17.35% | 210.6% | 315.75% | 389.5% | -9.04% | 39.6% | ★★ |
| 130 | Bayview Woods-Steeles | Toronto C15 | $1,199,256 | 41.04% | 16.04% | 91.0% | 110.88% | 136.8% | -5.67% | 36.1% | ★★ |
| 131 | Banbury-Don Mills | Toronto C13 | $1,199,256 | 8.77% | 42.91% | 140.9% | 169.85% | 209.5% | 8.80% | 48.0% | ★★ |
| 132 | Humber Heights | Toronto W09 | $2,507,174 | 31.16% | 89.18% | 129.6% | 100.78% | 124.3% | 9.78% | 95.6% | ★★ |
| 133 | Casa Loma | Toronto C02 | $4,755,258 | 6.53% | 14.74% | 124.0% | 210.70% | 259.9% | -2.02% | 27.0% | ★★ |
| 134 | Bridle Path-Sunnybrook-York Mills | Toronto C12 | $2,700,000 | 6.90% | 36.94% | 110.8% | 399.62% | 492.9% | -7.26% | 53.2% | ★★ |
Affiliate (monetized) links can sometimes result in a payment to MoneySense (owned by Ratehub Inc.), which helps our website stay free to our users. If a link has an asterisk (*) or is labelled as “Featured,” it is an affiliate link. If a link is labelled as “Sponsored,” it is a paid placement, which may or may not have an affiliate link. Our editorial content will never be influenced by these links. We are committed to looking at all available products in the market. Where a product ranks in our article, and whether or not it’s included in the first place, is never driven by compensation. For more details, read our MoneySense Monetization policy.
Share this article Share on Facebook Share on Twitter Share on Linkedin Share on Reddit Share on Email
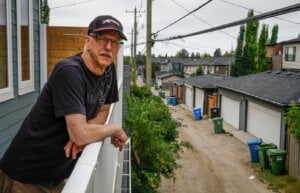
More Canadians are turning to laneway homes for affordable housing. Find out how much they cost and whether they're...

Before buying a home in Canada, U.S. citizens should understand the cross-border tax and ownership rules that can have...

Discover how the Smith Manoeuvre works, who it's right for, and the potential benefits and risks of using your...
Reverse mortgages let older Canadians unlock home equity without selling. Learn how they work, the costs, risks, and when...

Accessible home renovations can cost tens of thousands of dollars. Learn about grants, tax credits, and practical ways to...
Learn what condo fees pay for, why they rise over time, and how to assess a building's financial health...
If your landlord defaults and the home is sold, your tenancy may still be protected—but rules vary by province....
Thinking of selling your home without a Realtor? Here’s what DIY sellers need to know about commissions, legal risks,...

Short-term rentals can help cover housing costs, but experts say many first-time hosts underestimate the legal, financial, and lifestyle...

As falling home prices leave more Canadians underwater on their mortgages, experts explain the refinancing and renewal options available.
I want to know about real estate and mortgage