Battle of the generations: Who’s having the toughest time with finances in Canada?
Boomers admit they had it easier than others, but Gen Z gave themselves a C in paying off debt....
Advertisement
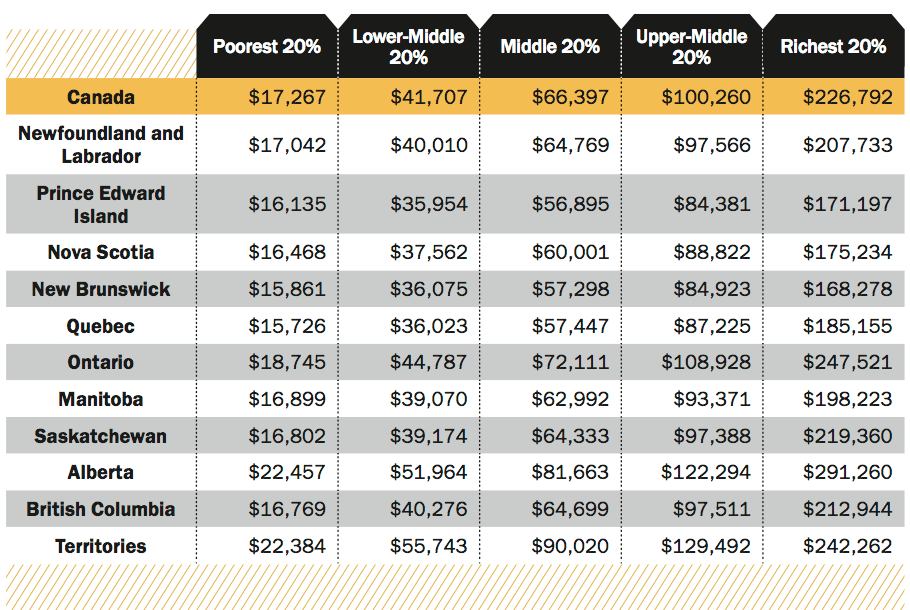
Have you ever wanted to know how much your neighbour makes but were too polite to ask? Here’s your chance to find out. We divvy up the population into five equal groups to show the range of incomes for both unattached individuals and families of two or more. For instance, if you’re single and making $30,000 a year before taxes, then you’d be ahead of the poorest 40% of Canadians, but behind the richest 40%.
Forget the glass ceiling: when it comes to the salary gap between the sexes, women have hit a brick wall. Women between the ages of 45 and 54 earn on average about $23,600 less than men in that same cohort, which is virtually unchanged from where it was five years ago, but the gap is narrower than back in 2000.
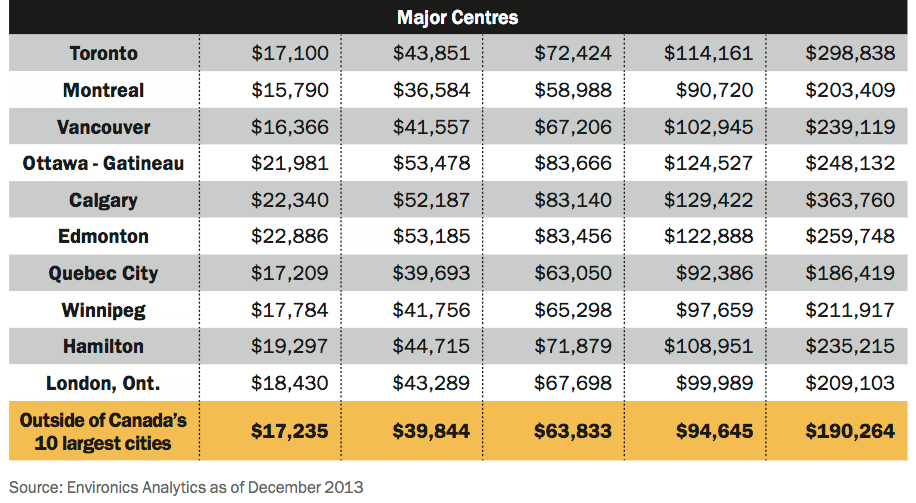
How your income stacks up against the rest of Canada is one thing, but if you really want to see how well you’re doing it’s best to compare yourself to the people around you. The tables below break down incomes by province and for the 10 largest cities in Canada. It makes a difference. For example, a middle income in all of Ontario is about $72,000, but that’s about $11,500 less than a middle income in Ottawa and some $4,500 more than a middle income in London, Ont.
Back in 2009 Canadian households saw their wealth dip by 10%. But the rebound was swift and complete: those net worths are 15% higher than they were five years ago. Since 2006, the average Canadian household has added about $75,000 to its net worth.
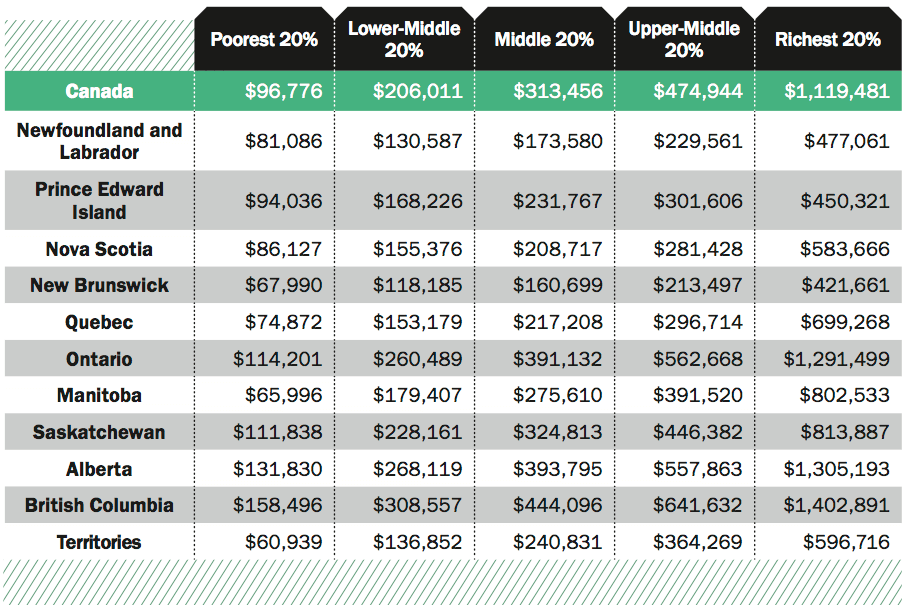
ou might be earning the big bucks, but income alone doesn’t make you wealthy. Your net worth is the best measure of overall wealth. It takes into account everything you own (real estate, pensions, RRSPs and other investments) minus everything you owe. When it comes to wealth, not surprisingly, families have the edge over individuals. The collective net worth of the lowest 40% of individuals wouldn’t match the poorest 20% of families.
Families can build wealth faster than individuals because they’re able to pool their resources, which enables them to pay down debts faster and make larger purchases. And what a difference it makes: between ages 55 and 65 families are worth, on average, a whopping $670,000 more than unattached individuals in the same age group.
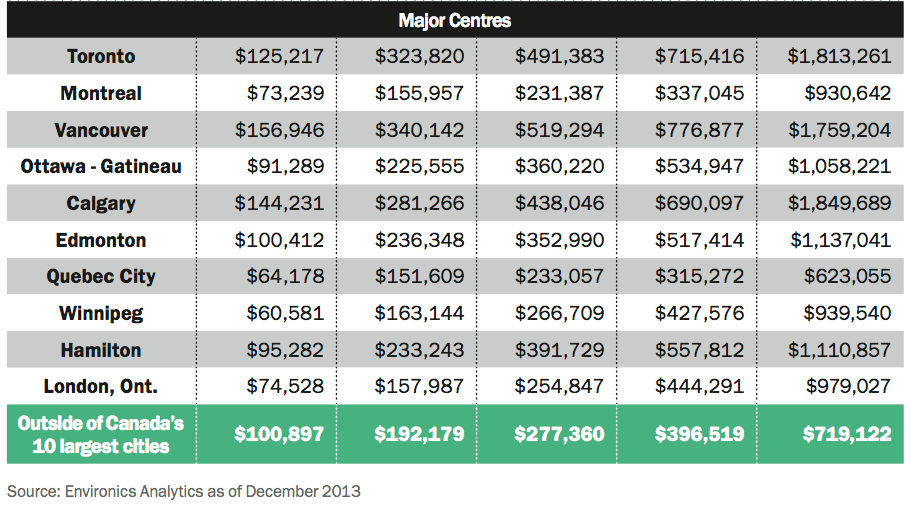
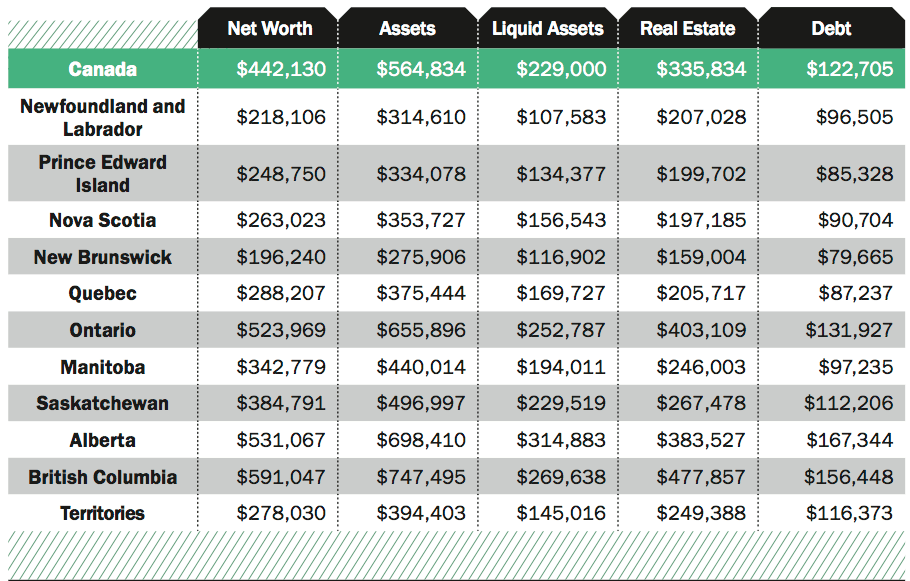
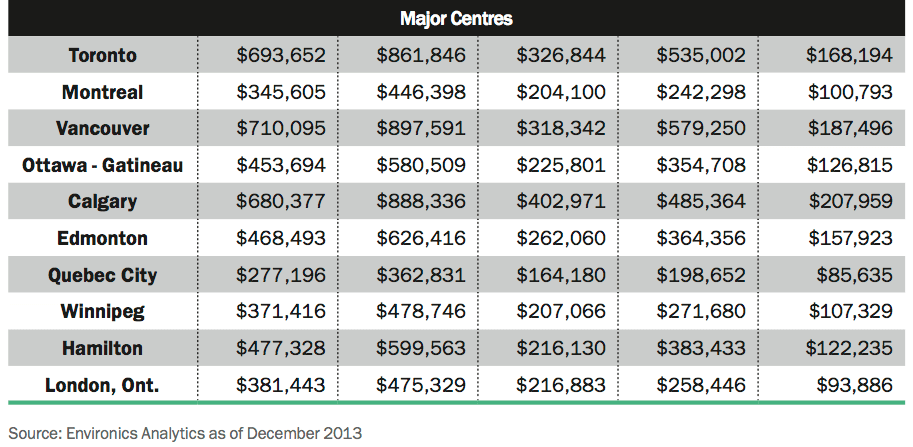
What about Canada’s biggest cities? Typically, middle-class households—and even those in the second-highest quintile—have net worths that fall in line with the national averages. While there are some variations, only Montreal and Quebec City underperform, which is mainly because households in Quebec are younger than other provinces and so have had less time to build up net worth, says Miron. The average net worth in the wealthiest quintiles is far more robust: $1,813,261 for Toronto, $1,849,689 for Calgary and $1,759,204 for Vancouver.
In Canada, home ownership is playing an increasingly large role in determining how wealthy we are—thanks to our seemingly bubble-proof housing boom. The tables below break down the average household net worth by province and by city, showing the true value of our assets minus our debt. Not surprisingly, in every region and major urban centre, the value of our real estate holdings outweigh our more immediately accessible liquid assets. Even economic powerhouse Alberta can’t buck this trend, nor can its shining star Calgary, the financial centre of western Canada.
Share this article Share on Facebook Share on Twitter Share on Linkedin Share on Reddit Share on Email