Still beating the market after 9 years
Last year's top picks returned 55%!
Advertisement
Last year's top picks returned 55%!
 Finding the right Christmas gift can be difficult and some people are particularly hard to shop for. The combination can, on occasion, make the holiday season feel like an exercise in passing the proverbial brown sweater back and forth.
Investors suffer from a similar problem when looking for good stocks. But, in some ways, they have it even worse because they have to wait for months, if not years, before finding out whether their picks turn out to be duds or stars.
To help you navigate through the market to find the very best prospects, we’re pleased to present you with the 10th annual MoneySense Top 200 guide to Canadian stocks. It’s packed full of information on the best companies in Canada.
We’re thrilled to report our efforts have paid off handsomely since last time. Our All-Star stocks, which combine the best growth and value characteristics, gained an average of 55.0% since last year. By way of comparison the Canadian market, as represented by the S&P/TSX Composite ETF (XIC), gained 7.2% over the same period. (Neither figure includes dividends.)
Such superb short-term results are one thing, but the All-Stars have shined over the long term too. If you had bought equal amounts of the All-Stars and rolled your gains into the new stocks each year, you’d have enjoyed 19.1% average annual returns over the last nine years. On the other hand, the S&P/TSX Composite (XIC) advanced 4.8% annually over the same period, which means the All-Stars beat the market by an average of 14.3 percentage points a year.
Finding the right Christmas gift can be difficult and some people are particularly hard to shop for. The combination can, on occasion, make the holiday season feel like an exercise in passing the proverbial brown sweater back and forth.
Investors suffer from a similar problem when looking for good stocks. But, in some ways, they have it even worse because they have to wait for months, if not years, before finding out whether their picks turn out to be duds or stars.
To help you navigate through the market to find the very best prospects, we’re pleased to present you with the 10th annual MoneySense Top 200 guide to Canadian stocks. It’s packed full of information on the best companies in Canada.
We’re thrilled to report our efforts have paid off handsomely since last time. Our All-Star stocks, which combine the best growth and value characteristics, gained an average of 55.0% since last year. By way of comparison the Canadian market, as represented by the S&P/TSX Composite ETF (XIC), gained 7.2% over the same period. (Neither figure includes dividends.)
Such superb short-term results are one thing, but the All-Stars have shined over the long term too. If you had bought equal amounts of the All-Stars and rolled your gains into the new stocks each year, you’d have enjoyed 19.1% average annual returns over the last nine years. On the other hand, the S&P/TSX Composite (XIC) advanced 4.8% annually over the same period, which means the All-Stars beat the market by an average of 14.3 percentage points a year.
Investors who put money into our All-Stars when we started nine years ago have enjoyed stellar returns, easily outpacing the S&P/TSX Composite Index. If you had split $100,000 equally among our original All-Stars, then sold each year’s picks to invest in the new picks, your portfolio would have almost quintupled in value to $481, 000 in nine years—and that’s not including dividends.
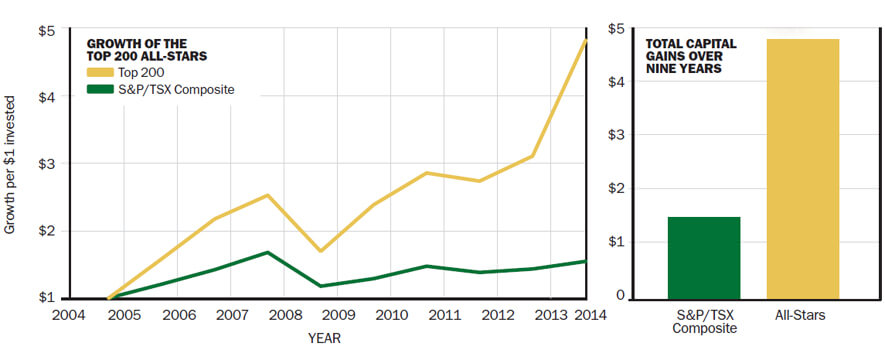 As you might imagine, we’re very pleased with our performance record. Just take a look at the charts above, which translate the percentages into more easily understandable dollar terms. If you had split $100,000 equally among the original All-Stars nine years ago, then sold them and moved your gains into the new stocks each year, your portfolio would now be worth approximately $481,000—almost five times your original investment. Again, that doesn’t include dividends, but they could have been used to buy more than a few presents over the years.
We’ll be toasting our success this holiday season, but remember stock-picking comes with more than a dash of risk and uncertainty. Our picks underperformed the market twice in the last nine years and we fully expect to encounter difficult periods in the future.
Also, some stocks that may look good today could go on to perform poorly. We hope to avoid such situations but we’re not always that lucky. That’s why it’s important to know what you’re getting into before diving into the stock market. Those starting out should read The MoneySense Guide to Investing in Stocks. It explains the basics of stock-picking and more advanced topics.
Still, we hope our track record whets your appetite for this year’s Top 200.
As in prior years, we scrutinize our 200 largest public companies and grade each on its investment merit.The Top 200 provides a logical, consistent, and easy-to-use approach to uncovering the best stocks. Like the penny-pinching Ebenezer Scrooge, our method isn’t swayed by feelings or fancies. Nor do we rely on gut instincts or exuberant expectations of what the future might bring. Instead, we focus on the numbers and our opinions about each company don’t enter into it.
We begin with the largest 200 companies in Canada, based on revenues, using data from Bloomberg. We then grade each stock for its investment appeal based on two measures. First we size up its merit as a value investment, then its attractiveness as a growth investment. (Value investors like to buy lots of assets for low prices while growth investors prefer firms with good sales and earnings growth.) Our tests use a set of complex calculations, but in the end we reduce everything about a stock to two simple grades: one for its growth potential and one for its value appeal.
The grades work like they did when you were in school. Top stocks are awarded As. Solid firms get by with Bs or Cs. Those that don’t quite measure up are sent home with a D or an F. We are attracted to stocks with good grades while those at the bottom should prompt serious second thoughts.
To get into the All-Star list, a stock must achieve at least one A and one B on the value and growth tests. Only 11 made it into this elite group this year.
As you might imagine, we’re very pleased with our performance record. Just take a look at the charts above, which translate the percentages into more easily understandable dollar terms. If you had split $100,000 equally among the original All-Stars nine years ago, then sold them and moved your gains into the new stocks each year, your portfolio would now be worth approximately $481,000—almost five times your original investment. Again, that doesn’t include dividends, but they could have been used to buy more than a few presents over the years.
We’ll be toasting our success this holiday season, but remember stock-picking comes with more than a dash of risk and uncertainty. Our picks underperformed the market twice in the last nine years and we fully expect to encounter difficult periods in the future.
Also, some stocks that may look good today could go on to perform poorly. We hope to avoid such situations but we’re not always that lucky. That’s why it’s important to know what you’re getting into before diving into the stock market. Those starting out should read The MoneySense Guide to Investing in Stocks. It explains the basics of stock-picking and more advanced topics.
Still, we hope our track record whets your appetite for this year’s Top 200.
As in prior years, we scrutinize our 200 largest public companies and grade each on its investment merit.The Top 200 provides a logical, consistent, and easy-to-use approach to uncovering the best stocks. Like the penny-pinching Ebenezer Scrooge, our method isn’t swayed by feelings or fancies. Nor do we rely on gut instincts or exuberant expectations of what the future might bring. Instead, we focus on the numbers and our opinions about each company don’t enter into it.
We begin with the largest 200 companies in Canada, based on revenues, using data from Bloomberg. We then grade each stock for its investment appeal based on two measures. First we size up its merit as a value investment, then its attractiveness as a growth investment. (Value investors like to buy lots of assets for low prices while growth investors prefer firms with good sales and earnings growth.) Our tests use a set of complex calculations, but in the end we reduce everything about a stock to two simple grades: one for its growth potential and one for its value appeal.
The grades work like they did when you were in school. Top stocks are awarded As. Solid firms get by with Bs or Cs. Those that don’t quite measure up are sent home with a D or an F. We are attracted to stocks with good grades while those at the bottom should prompt serious second thoughts.
To get into the All-Star list, a stock must achieve at least one A and one B on the value and growth tests. Only 11 made it into this elite group this year.
 Visit the Top 200 list. To see the All-Star stocks and all our grades plus the top American stocks, pick up the December/January issue of MoneySense on newsstands now. Or download the full package online including bonus picks and a worksheet. The download is FREE for subscribers.Visit the Top 200 list. To see the All-Star stocks and all our grades plus the top American stocks, pick up the December/January issue of MoneySense on newsstands now. Or download the full package online including bonus picks and a worksheet. The download is FREE for subscribers.
Share this article Share on Facebook Share on Twitter Share on Linkedin Share on Reddit Share on Email

The first quarter finally broke the pattern of steadily rising markets, but energy stocks soared.

Wealthsimple's direct indexing brings a tax-saving investing strategy to a wider group of investors, but the number likely to...

Look under the hood before buying some popular Canadian sector ETFs. There may be alternatives that better represent the...

Lululemon profits dip, Couche-Tard surges, and Power Corp declines. Here’s what investors need to know about Q4 results...

Canadian companies face a turbulent quarter, with Algoma Steel losing big and Transat posting gains amid major corporate moves.

Q4 shows mixed results across sectors: Canadian Natural and Pet Valu post gains, while George Weston and Canada Packers...

Canada’s banking sector sees higher Q1 profits and strong financial performance in the latest earnings reports.

From big profit jumps at Enbridge and Cenovus to strong holiday sales at Canadian Tire, see how major Canadian...

Manulife reports $1.5B in Q4 profit while Air Canada rebounds to $296M. See how Sun Life, Brookfield, and other...

Find out which Canadian robo-advisors offer the lowest fees, helpful support, best returns, and most account types with the...