Where to buy real estate in Canada 2021: Peel Region
Presented by
Ratehub.ca
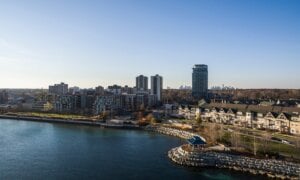
With easy access to downtown Toronto and more spacious properties, Peel Region is an area to watch real estate in for 2021. Here are the neighbourhoods to keep your eye on.
Advertisement
Presented by
Ratehub.ca
With easy access to downtown Toronto and more spacious properties, Peel Region is an area to watch real estate in for 2021. Here are the neighbourhoods to keep your eye on.
| City | Postal FSA | Neighbourhood name | Overall rank | Avg price 2020 | 1-year growth | 3-year growth | 5-year growth | Value score (out of 5 stars) | Neighbourhood economics score (out of 5 stars) | Neighbourhood accessibility score (out of 5 stars) | % Households with Children |
|---|---|---|---|---|---|---|---|---|---|---|---|
| caledon | L7K | mono mills | 1 | $1,020,175 | 40.7% | 44.7% | 105.0% | 4.5 | 4.7 | 0.4 | 46.7% |
| caledon | L7K | alton | 2 | $1,029,796 | 32.3% | 44.9% | 134.4% | 4.2 | 4.7 | 0.4 | 46.7% |
| mississauga | L5N | meadowvale | 3 | $744,968 | 15.7% | 25.4% | 66.2% | 3.5 | 4.2 | 3.9 | 60.4% |
| mississauga | L5J | southdown | 4 | $636,979 | 25.0% | 19.4% | 47.2% | 4.1 | 3.5 | 2.4 | 48.4% |
| mississauga | L5N | meadowvale business park | 5 | $801,567 | 17.4% | 14.4% | 59.2% | 3.3 | 4.2 | 3.9 | 60.4% |
| caledon | L7E | bolton | 6 | $896,157 | 14.1% | 16.7% | 62.1% | 2.9 | 4.6 | 2.5 | 60.8% |
| mississauga | L5W | meadowvale village | 7 | $970,538 | 13.6% | 6.2% | 50.6% | 2.4 | 5.0 | 2.4 | 70.6% |
| mississauga | L5M | streetsville | 8 | $940,642 | 15.6% | 16.8% | 69.5% | 2.8 | 4.5 | 3.0 | 62.7% |
| caledon | L7C | cheltenham | 9 | $1,222,214 | 30.0% | 11.6% | 76.5% | 2.7 | 4.7 | 0.0 | 54.1% |
| brampton | L7A | northwest sandalwood parkway | 10 | $842,554 | 16.5% | 17.9% | 74.8% | 3.2 | 4.1 | 2.2 | 66.8% |
| mississauga | L5M | central erin mills | 11 | $881,307 | 14.7% | 16.7% | 47.5% | 2.8 | 4.5 | 3.0 | 62.7% |
| mississauga | L5M | churchill meadows | 12 | $883,764 | 13.2% | 16.0% | 49.2% | 2.7 | 4.5 | 3.0 | 62.7% |
| mississauga | L5L | western business park | 13 | $741,454 | 14.8% | 10.0% | 59.8% | 3.3 | 4.0 | 4.4 | 52.7% |
| brampton | L6Z | heart lake east | 14 | $766,636 | 14.9% | 16.1% | 70.8% | 3.4 | 3.8 | 1.5 | 57.5% |
| brampton | L7A | fletcher's meadow | 15 | $851,076 | 14.2% | 15.6% | 69.4% | 3.0 | 4.1 | 2.2 | 66.8% |
| brampton | L6X | downtown brampton | 16 | $670,120 | 21.6% | 27.8% | 41.6% | 3.9 | 3.2 | 2.0 | 58.7% |
| brampton | L7A | northwest brampton | 17 | $851,985 | 12.7% | 15.0% | 72.5% | 3.0 | 4.1 | 2.2 | 66.8% |
| brampton | L6Z | heart lake west | 18 | $778,018 | 12.5% | 16.1% | 71.8% | 3.2 | 3.8 | 1.5 | 57.5% |
| brampton | L7A | snelgrove | 19 | $1,042,847 | 22.7% | 18.4% | 67.9% | 2.9 | 4.1 | 2.2 | 66.8% |
| mississauga | L5L | erin mills | 20 | $955,356 | 22.7% | 11.7% | 61.5% | 3.0 | 4.0 | 4.4 | 52.7% |
| brampton | L6S | westgate | 21 | $849,750 | 23.2% | 31.4% | 89.8% | 3.8 | 3.1 | 2.7 | 54.2% |
| brampton | L6Y | brampton south | 22 | $742,262 | 30.0% | 37.5% | 79.7% | 4.5 | 2.4 | 1.0 | 54.6% |
| brampton | L6S | northgate | 23 | $714,694 | 18.1% | 22.0% | 74.6% | 3.8 | 3.1 | 2.7 | 54.2% |
| brampton | L6X | brampton west | 24 | $733,627 | 15.5% | 21.5% | 81.1% | 3.6 | 3.2 | 2.0 | 58.7% |
| caledon | L7C | caledon east | 25 | $1,193,007 | 15.2% | 23.1% | 71.7% | 2.1 | 4.7 | 0.0 | 54.1% |
| mississauga | L5N | lisgar | 26 | $892,561 | 9.9% | 10.0% | 56.6% | 2.5 | 4.2 | 3.9 | 60.4% |
| brampton | L6S | central park | 27 | $658,132 | 11.5% | 21.3% | 81.8% | 3.7 | 3.1 | 2.7 | 54.2% |
| caledon | L7C | rural caledon | 28 | $1,207,200 | 17.5% | 13.9% | 56.7% | 2.0 | 4.7 | 0.0 | 54.1% |
| brampton | L6P | bram east | 29 | $939,671 | 17.2% | 14.6% | 47.9% | 2.7 | 3.9 | 2.2 | 64.1% |
| mississauga | L5R | hurontario | 30 | $731,362 | 16.3% | 20.4% | 58.6% | 3.5 | 3.1 | 3.3 | 53.0% |
| brampton | L6R | sandringham-wellington | 31 | $840,127 | 13.3% | 16.0% | 67.1% | 3.0 | 3.4 | 2.7 | 62.9% |
| caledon | L7K | caledon village | 32 | $1,092,086 | 0.9% | 20.3% | 71.3% | 1.7 | 4.7 | 0.4 | 46.7% |
| brampton | L6X | northwood park | 33 | $799,931 | 14.2% | 17.3% | 68.2% | 3.2 | 3.2 | 2.0 | 58.7% |
| mississauga | L5V | east credit | 34 | $982,752 | 10.8% | 8.6% | 49.9% | 2.2 | 4.2 | 1.9 | 67.8% |
| mississauga | L4W | rathwood | 35 | $842,645 | 9.6% | 10.4% | 47.5% | 2.6 | 3.7 | 4.1 | 50.2% |
| brampton | L6X | fletcher's creek village | 36 | $801,824 | 9.0% | 19.2% | 69.3% | 3.0 | 3.2 | 2.0 | 58.7% |
| brampton | L6Y | fletcher's creek south | 37 | $761,447 | 17.0% | 20.1% | 81.0% | 3.6 | 2.4 | 1.0 | 54.6% |
| brampton | L6P | vales of castlemore north | 38 | $1,284,405 | 22.7% | 13.8% | 74.8% | 2.1 | 3.9 | 2.2 | 64.1% |
| brampton | L6S | bramalea north industrial | 39 | $908,643 | 14.6% | 17.3% | 63.8% | 2.9 | 3.1 | 2.7 | 54.2% |
| caledon | L7C | inglewood | 40 | $1,091,382 | -0.3% | 4.2% | 47.2% | 1.3 | 4.7 | 0.0 | 54.1% |
| caledon | L7E | palgrave | 41 | $1,511,161 | 22.7% | 12.0% | 68.7% | 1.3 | 4.6 | 2.5 | 60.8% |
| mississauga | L5C | erindale | 42 | $856,904 | 13.3% | 15.4% | 51.9% | 2.8 | 3.1 | 2.8 | 52.8% |
| mississauga | L5B | city centre | 43 | $547,967 | 12.5% | 38.1% | 84.8% | 4.3 | 1.6 | 4.9 | 42.9% |
| brampton | L6P | vales of castlemore | 44 | $1,101,236 | 11.7% | 11.1% | 64.1% | 2.0 | 3.9 | 2.2 | 64.1% |
| brampton | L6S | gore industrial north | 45 | $843,375 | 13.8% | 4.1% | 59.7% | 2.8 | 3.1 | 2.7 | 54.2% |
| mississauga | L5B | fairview | 46 | $645,022 | 17.8% | 36.3% | 81.7% | 4.2 | 1.6 | 4.9 | 42.9% |
| brampton | L6X | credit valley | 47 | $1,058,078 | 19.1% | 15.2% | 68.1% | 2.6 | 3.2 | 2.0 | 58.7% |
| brampton | L6Y | fletcher's west | 48 | $834,084 | 16.3% | 19.1% | 75.8% | 3.3 | 2.4 | 1.0 | 54.6% |
| mississauga | L5B | creditview | 49 | $668,919 | 17.8% | 31.7% | 52.3% | 3.9 | 1.6 | 4.9 | 42.9% |
| brampton | L6T | queen street corridor | 50 | $471,662 | 18.0% | 35.1% | 115.3% | 5.0 | 0.4 | 2.8 | 52.0% |
| mississauga | L5E | lakeview | 51 | $986,923 | 10.1% | 14.2% | 57.1% | 2.3 | 3.1 | 2.6 | 41.3% |
| mississauga | L5J | clarkson-lorne park | 52 | $1,254,358 | 19.2% | 12.0% | 53.0% | 1.9 | 3.5 | 2.4 | 48.4% |
| brampton | L6T | bramalea west industrial | 53 | $658,804 | 30.2% | 42.8% | 75.4% | 4.8 | 0.4 | 2.8 | 52.0% |
| mississauga | L5K | sheridan park | 54 | $851,493 | 11.4% | 7.6% | 49.8% | 2.6 | 2.6 | 3.5 | 53.0% |
| mississauga | L4Y | applewood | 55 | $726,887 | 11.4% | 18.9% | 54.3% | 3.2 | 2.0 | 2.3 | 46.2% |
| brampton | L6V | madoc | 56 | $726,294 | 17.2% | 23.7% | 78.5% | 3.7 | 1.4 | 1.9 | 52.7% |
| brampton | L6V | brampton north | 57 | $673,607 | 14.4% | 20.4% | 75.3% | 3.7 | 1.4 | 1.9 | 52.7% |
| mississauga | L5B | cooksville | 58 | $764,570 | 10.7% | 33.1% | 68.9% | 3.4 | 1.6 | 4.9 | 42.9% |
| brampton | L6Y | bram west | 59 | $1,001,605 | 17.1% | 11.5% | 57.3% | 2.6 | 2.4 | 1.0 | 54.6% |
| brampton | L6W | brampton east | 60 | $749,100 | 16.7% | 17.7% | 64.5% | 3.5 | 1.3 | 3.5 | 44.3% |
| brampton | L6T | southgate | 61 | $657,948 | 16.3% | 23.2% | 90.4% | 4.0 | 0.4 | 2.8 | 52.0% |
| mississauga | L5A | mississauga valleys | 62 | $630,635 | 15.9% | 24.7% | 70.5% | 3.9 | 0.5 | 2.7 | 45.9% |
| mississauga | L4T | malton | 63 | $698,216 | 14.8% | 25.1% | 68.0% | 3.7 | 0.7 | 2.4 | 55.4% |
| mississauga | L5K | sheridan | 64 | $1,085,292 | 10.6% | -14.8% | 20.8% | 1.4 | 2.6 | 3.5 | 53.0% |
| mississauga | L5G | port credit | 65 | $1,292,767 | 16.0% | 29.3% | 62.8% | 1.9 | 2.1 | 2.6 | 38.7% |
| brampton | L6P | toronto gore rural estate | 66 | $1,782,114 | 14.2% | 21.9% | 40.8% | 0.0 | 3.9 | 2.2 | 64.1% |
| mississauga | L4X | dixie | 67 | $964,147 | 14.9% | 79.4% | 113.3% | 3.9 | 0.0 | 2.9 | 52.1% |
| brampton | L6T | avondale | 68 | $696,440 | 11.5% | 15.8% | 75.3% | 3.4 | 0.4 | 2.8 | 52.0% |
| mississauga | L5G | mineola | 69 | $1,695,628 | 28.4% | 17.5% | 59.4% | 1.1 | 2.1 | 2.6 | 38.7% |
Shop for the best mortgage rate on Ratehub.ca* »
Share this article Share on Facebook Share on Twitter Share on Linkedin Share on Reddit Share on Email

If your landlord defaults and the home is sold, your tenancy may still be protected—but rules vary by province....
Thinking of selling your home without a Realtor? Here’s what DIY sellers need to know about commissions, legal risks,...

Short-term rentals can help cover housing costs, but experts say many first-time hosts underestimate the legal, financial, and lifestyle...

As falling home prices leave more Canadians underwater on their mortgages, experts explain the refinancing and renewal options available.

Buying a home can change your life insurance needs fast. Here’s how much coverage young Canadians may actually need—and...

Bank of Canada holds its 2.25% rate for a fourth time amid inflation risks from oil prices, affecting mortgages,...