Beyond home prices: What the new CMHC affordability index reveals about Canada
Canada’s housing affordability is usually measured through home prices alone. CMHC’s new index adds rental data for a more complete national picture.
Advertisement
Canada’s housing affordability is usually measured through home prices alone. CMHC’s new index adds rental data for a more complete national picture.

Take a look at just about any housing affordability index in the country and you’ll notice something pretty quickly: they almost always focus exclusively on home prices and mortgages. Rental units simply aren’t included.
The Canada Mortgage and Housing Corporation (CMHC) has acknowledged this gap, which overlooks roughly one-third of Canadians who rent. Its newly released comprehensive housing affordability index changes that by including both owners and renters, while also expanding its focus beyond a handful of major metro areas. The result is a more complete view of housing affordability across the country.
Pull up a standard housing affordability index and you’ll find it primarily looks at housing prices and vacancy rates. The goal of any of these indexes is to show how much disposable income it would take to afford buying a home.
But what if you have no intention of purchasing a house, condo, or apartment? That’s where the new CMHC housing affordability index comes into play. It’s unique because it includes rental information. As Joelle Hamilton, Communications & Marketing for CMHC, says, “By looking at both the rental and buying markets, we get a more complete view of affordability.”
Answer a few quick questions to get a personalized quote, whether you’re buying, renewing or refinancing.
The index is also more comprehensive than most that simply look at major metro homeownership data. Hamilton said, “We often hear about housing pressures in Vancouver and Toronto, and those markets absolutely matter. But if we focus only on those two cities, we miss what’s happening elsewhere in the country. When you break it down by market and region, the picture can look very different.”
In addition to using data for Vancouver and Toronto, the CMHC index also looks at housing and rental information for:
Mathieu Laberge, Chief Economist at CMHC, notes that 20 years ago, affordability challenges were largely concentrated in Vancouver and Toronto. Between 2020 and 2023, however, those pressures broadened across the country. The expanded affordability index makes this shift much easier to see.
By contrast, a traditional affordability index that focuses only on homeownership in Vancouver and Toronto can miss this broader trend. It may still suggest that Canada’s affordability challenges are primarily confined to those two cities, even as conditions have deteriorated across many other regions.
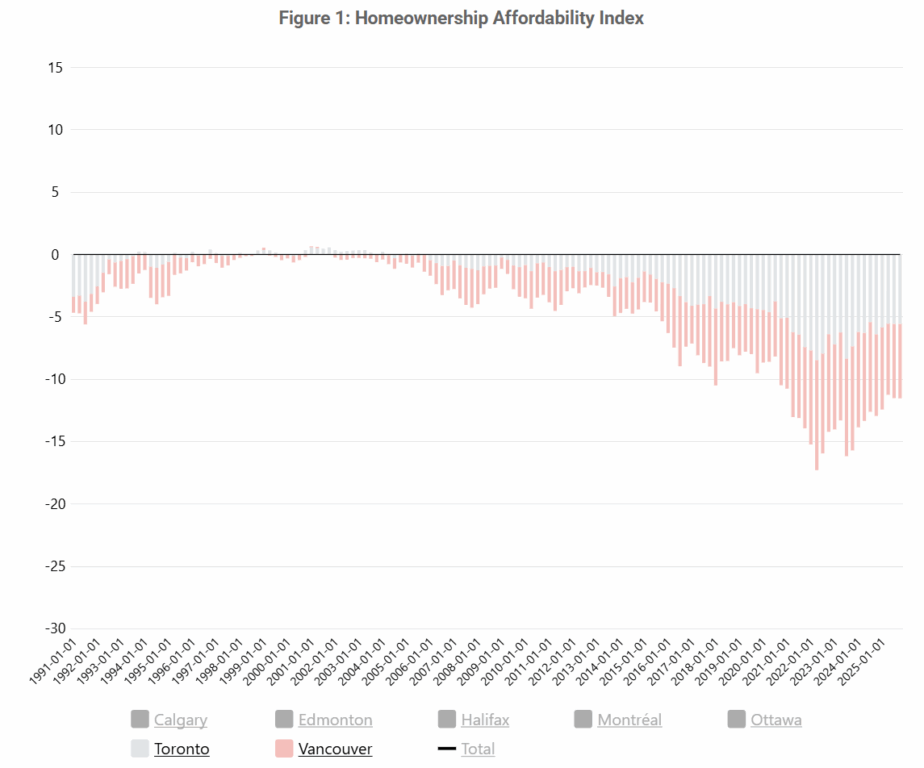
Take a look at this chart, which, on its own, can give the impression that homeownership in Canada remains entirely unaffordable, without capturing how and where those pressures have actually evolved.
Now, compare this chart with the following, which includes regions across Canada.
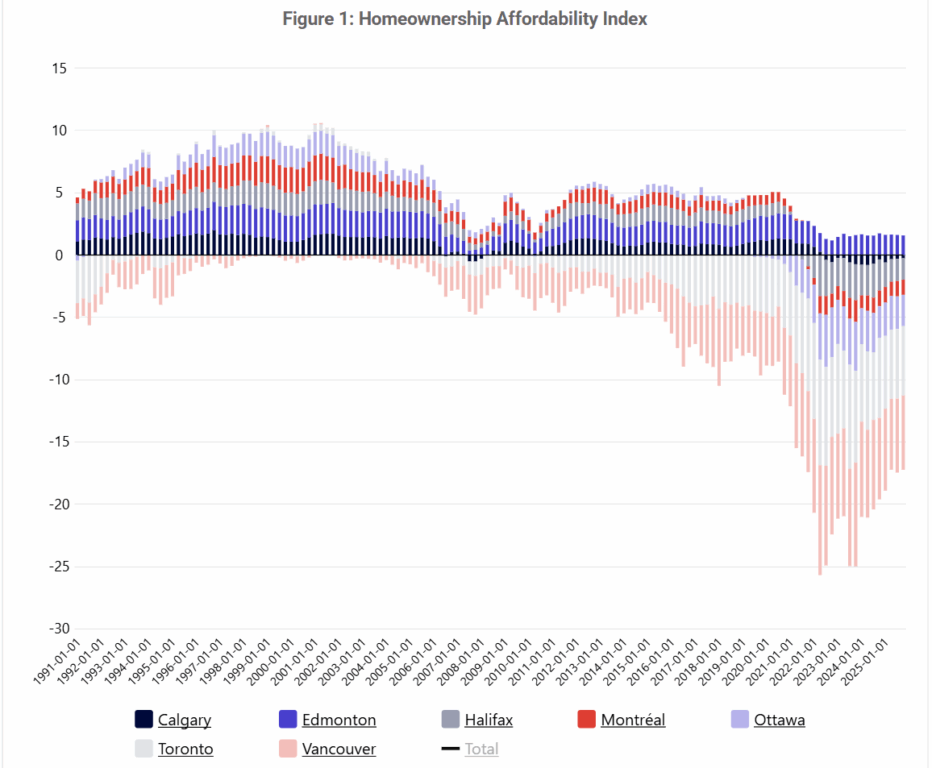
As the data shows, housing affordability is currently strongest in Edmonton, and there are signs of improvement in several other regions, as well.
“Since 2023, we’ve seen slight improvements in some regions, particularly in Ottawa, Toronto, Vancouver, and Halifax. In Montréal, Calgary, and Edmonton, affordability appears to be stabilizing. That doesn’t mean challenges are gone, but it does suggest momentum may be shifting in some markets,” said Laberge.
These differences may be subtle, but they highlight why it’s important to look beyond just a few major metro areas when assessing affordability trends.
A more comprehensive affordability index can help Canadians better understand which regions are relatively more affordable, while also giving policymakers and developers a clearer view of where there are imbalances between supply and demand.
If you thought the expanded homeownership data was useful, wait until you see the rental information included in the CMHC index. Based on traditional data that focuses mainly on Vancouver and Toronto, it would be easy to assume that renting across Canada is uniformly unaffordable.
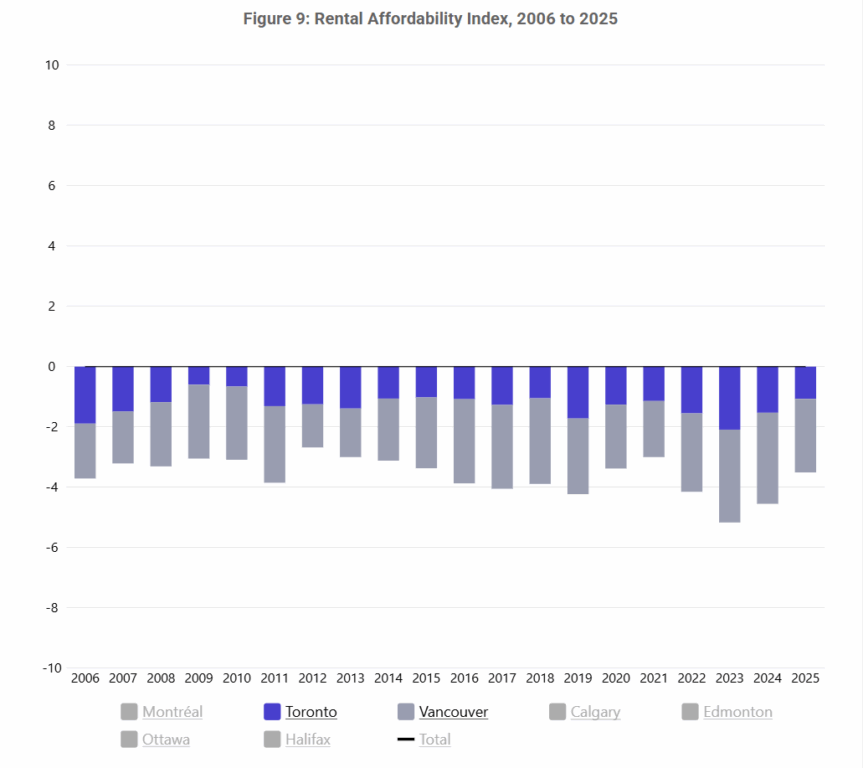
But it’s more nuanced than that. When we look at rental affordability across a wider range of cities, it becomes clear that conditions vary significantly depending on the location.
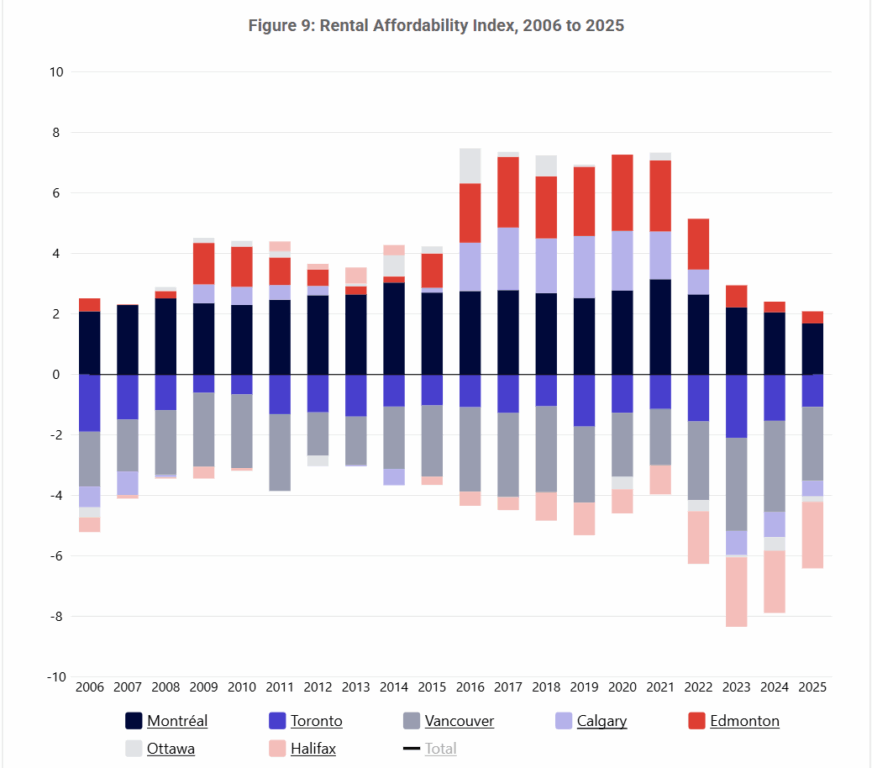
A comparison of CMHC’s rental and homeownership data shows that rental affordability tends to be more stable over time, while homeownership affordability is more sensitive to market shifts.
As Hamilton explains, “By looking at both renting and buying, and by breaking it down by region, we get a clearer understanding of where pressures are strongest. And that helps us identify what kind of housing solutions are needed. Because better data leads to better decisions.”
The 30% rent rule is a guideline suggesting that renters should spend no more than 30% of their gross (before-tax) household income on rent and essential utilities like electricity, heat, and water. The idea is to leave the remaining 70% of income available for other necessities like food, transportation, savings, and discretionary spending.
No. Multiple organizations develop their own housing affordability indexes, including government agencies, provincial bodies, major banks, and private companies. What sets the CMHC index apart is that it’s one of the first to incorporate both renting and homeownership, rather than focusing on buyers alone.
Rather than looking only at home prices, the CMHC index combines data from both rental and ownership markets. It also factors in broader affordability pressures such as household income, housing supply and demand, and overall housing-related costs.
Share this article Share on Facebook Share on Twitter Share on Linkedin Share on Reddit Share on Email

Reverse mortgages let older Canadians unlock home equity without selling. Learn how they work, the costs, risks, and when...

Accessible home renovations can cost tens of thousands of dollars. Learn about grants, tax credits, and practical ways to...

Learn what condo fees pay for, why they rise over time, and how to assess a building's financial health...

If your landlord defaults and the home is sold, your tenancy may still be protected—but rules vary by province....

Thinking of selling your home without a Realtor? Here’s what DIY sellers need to know about commissions, legal risks,...

Short-term rentals can help cover housing costs, but experts say many first-time hosts underestimate the legal, financial, and lifestyle...

As falling home prices leave more Canadians underwater on their mortgages, experts explain the refinancing and renewal options available.

Buying a home can change your life insurance needs fast. Here’s how much coverage young Canadians may actually need—and...

Bank of Canada holds its 2.25% rate for a fourth time amid inflation risks from oil prices, affecting mortgages,...