What housing inventory numbers can tell us
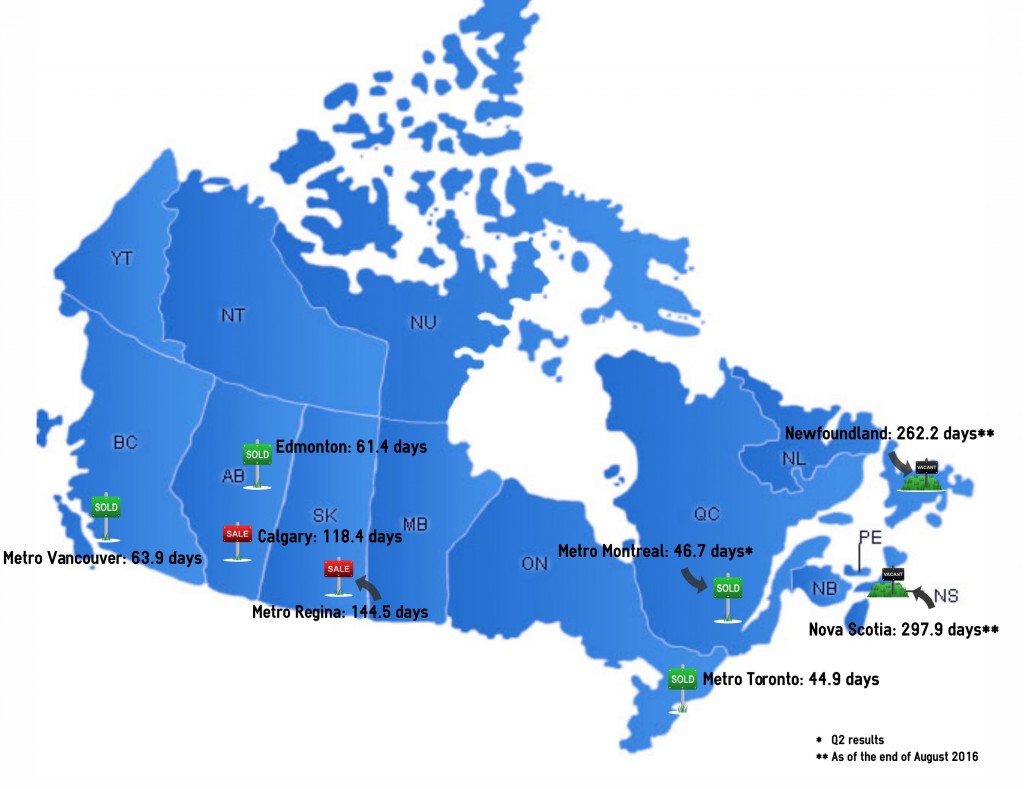
The months of inventory ratio shows most of the country is in a seller's market, as of September 2016
Advertisement
The months of inventory ratio shows most of the country is in a seller's market, as of September 2016
Active listings for a given period / number of sales for a given period = # MOI
| Province | City | Days of inventory | MOI (months of inventory) | Type of market |
| Nova Scotia** | 297.9 | 9.9 | Buyer | |
| Newfoundland** | 262.2 | 8.7 | Buyer | |
| Quebec | Montreal Island* | 46.7 | 1.6 | Seller |
| Quebec City* | 51.2 | 1.7 | Seller | |
| Ontario | Hamilton | 36.8 | 1.2 | Seller |
| Oshawa | 36.8 | 1.2 | Seller | |
| Pickering | 38.5 | 1.3 | Seller | |
| Burlington | 38.8 | 1.3 | Seller | |
| Brampton | 40.3 | 1.4 | Seller | |
| City of Toronto | 44.9 | 1.5 | Seller | |
| Central Toronto | 46.1 | 1.6 | Seller | |
| Markham | 46.5 | 1.6 | Seller | |
| Manitoba | Winnipeg | 77 days | 2.6 | Seller |
| Saskatchewan | Saskatoon | 77.1 | 2.57 | Seller |
| Regina City | 144.5 | 4.8 | Balanced | |
| Alberta | Edmonton | 61.4 | 2.1 | Seller |
| Calgary | 118.4 | 4 | Balanced | |
| British Columbia | Metro Vancouver | 63.9 | 2.1 | Seller |
| Victoria | 79.2 | 2.6 | Seller |
Share this article Share on Facebook Share on Twitter Share on Linkedin Share on Reddit Share on Email

Is your salary enough to buy a home in these Canadian cities? Here’s how much you needed to earn...

Learn how to choose a professional appraisal firm in Canada. Get tips on credentials, local expertise, services, and reliable,...

Planning a move to a new city involves budgeting, accounting for hidden costs, and using expert advice to navigate...

From micro-apartments to co-living, Gen Z is finding clever ways to balance cost, convenience, and lifestyle as offices reopen.

GTA housing sales up 8.5% in September as prices decline, with falling interest rates encouraging more buyers into the...

Our “Where to Buy Real Estate in Canada 2025” survey turns up a wealth of cities and neighbourhoods with...

Sponsored By
Coast Capital


Created By
Ratehub

A MoneySense reader asks about survivor benefits for spouses. Here’s how defined benefit and CPP survivor payments work in...

If you’re thinking about buying your first recreational property, now may be the right time. Here's what to know.