The market is doing better than you think
S&P/TSX Composite total return index climbed 837% since 1987
Advertisement
S&P/TSX Composite total return index climbed 837% since 1987
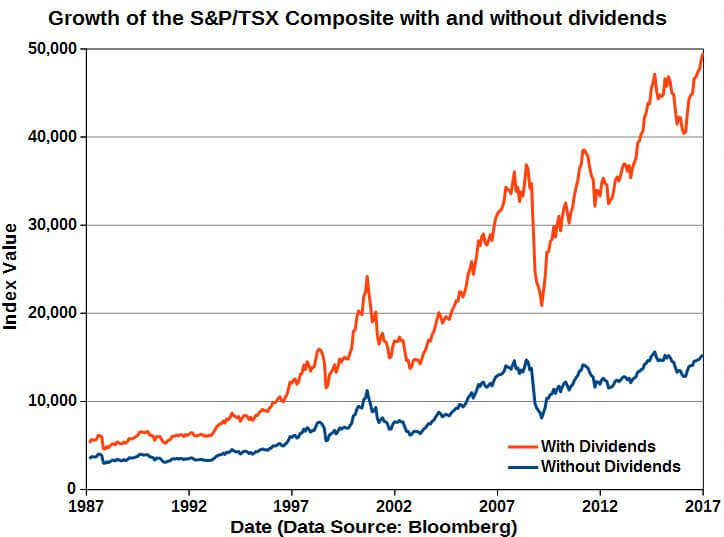 The graph is based on monthly data from Bloomberg, which happens to start at the end of February 1987 and goes through to the end of December 2016. Over the whole period the price index (the one that does not include dividends) climbed 5.07% annually whereas the total return index (the one that includes reinvested dividends) climbed 7.79% annually.
The difference between the two is dramatic when overall rather than annualized returns are considered. The price index climbed 337% from early 1987 to the end of 2016 whereas the total return index advanced by a whopping 837%.
Dividends can also make a difference over shorter periods. For instance, the price index hit a peak in the summer of 2008 before the market crashed later that year. It went on to gain 3.89% from the summer of 2008 to the end of 2016. That’s equivalent to a tiny annualized gain of 0.45%. The situation is better when dividends are added to the mix. The total return index gained 34.30% over the same period or 3.49% per year on an annualized basis. While those aren’t the best returns in the world, they are a good deal better than the near break-even results of the index without dividends.
So, when you hear about the markets on the nightly news it is important to remember that the situation is probably better than reported due to the humble dividend.
The graph is based on monthly data from Bloomberg, which happens to start at the end of February 1987 and goes through to the end of December 2016. Over the whole period the price index (the one that does not include dividends) climbed 5.07% annually whereas the total return index (the one that includes reinvested dividends) climbed 7.79% annually.
The difference between the two is dramatic when overall rather than annualized returns are considered. The price index climbed 337% from early 1987 to the end of 2016 whereas the total return index advanced by a whopping 837%.
Dividends can also make a difference over shorter periods. For instance, the price index hit a peak in the summer of 2008 before the market crashed later that year. It went on to gain 3.89% from the summer of 2008 to the end of 2016. That’s equivalent to a tiny annualized gain of 0.45%. The situation is better when dividends are added to the mix. The total return index gained 34.30% over the same period or 3.49% per year on an annualized basis. While those aren’t the best returns in the world, they are a good deal better than the near break-even results of the index without dividends.
So, when you hear about the markets on the nightly news it is important to remember that the situation is probably better than reported due to the humble dividend.
| Name | Price | P/B | P/E | Earnings Yield | Dividend Yield |
|---|---|---|---|---|---|
| BCE (BCE) | $58.66 | 4.1 | 18.56 | 5.39% | 4.65% |
| Emera (EMA) | $45.44 | 1.68 | 18.3 | 5.47% | 4.60% |
| CIBC (CM) | $110.81 | 1.96 | 10.34 | 9.67% | 4.48% |
| TELUS (T) | $43.44 | 3.1 | 18.33 | 5.46% | 4.42% |
| Power (POW) | $30.53 | 1.12 | 15.21 | 6.57% | 4.39% |
| Shaw (SJR.B) | $28.07 | 2.52 | 12.48 | 8.02% | 4.22% |
| National Bank (NA) | $56.17 | 1.97 | 16.97 | 5.89% | 3.99% |
| Fortis (FTS) | $41.84 | 1.48 | 22.26 | 4.49% | 3.82% |
| Bank of Nova Scotia (BNS) | $77.76 | 1.78 | 13.38 | 7.47% | 3.81% |
| Bank of Montreal (BMO) | $98.43 | 1.65 | 14.16 | 7.06% | 3.58% |
Share this article Share on Facebook Share on Twitter Share on Linkedin Share on Reddit Share on Email

Which ETFs should you invest in? Which ones best suit your risk tolerance? What about personal ethics? Check out...

Canadian investors got a wave of earnings news this week, from Barrick’s profit surge to stronger results at Cineplex...

Investors may be paying high fees for lower risk-adjusted returns with these concentrated covered-call ETFs, all in the name...

Find the best GIC rates in Canada. Plus, everything you need to know about how they work.

Moving to the U.S. can change how an RESP works. CESG eligibility may stop, and U.S. tax rules can...

A practical guide to developing-country equity ETFs, covering classification differences, higher volatility, and key tax considerations for Canadian investors.

A mixed Q1 earnings roundup that includes gains from Bombardier and Gildan alongside losses at Spin Master and others.

Most Canadian parents are saving for their child’s education, but few feel confident it will be enough. Here’s why...

Opening an RESP is a smart move—but how it’s set up can affect who controls the money, access to...

The $25B Canada Strong Fund will back domestic industries and infrastructure. Here’s how sovereign wealth funds work and what...