Screening for top U.S. stock prospects in 2018
30 stocks to buy for both growth and value
Advertisement
30 stocks to buy for both growth and value

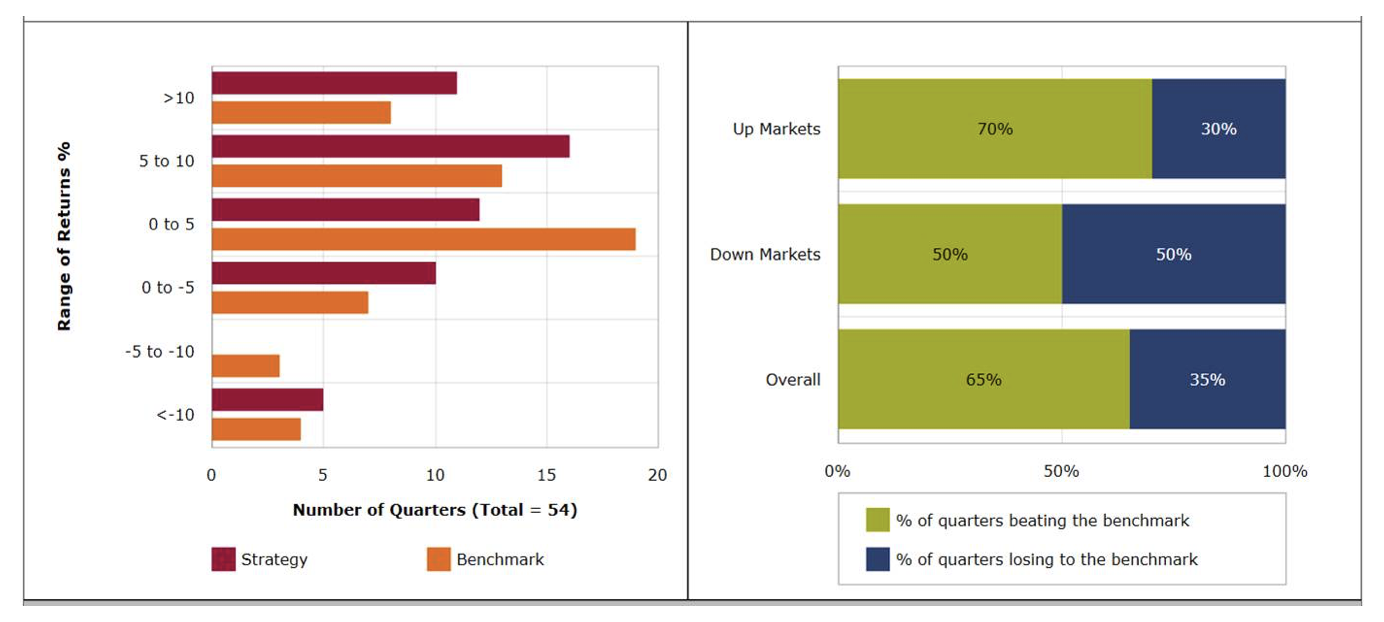
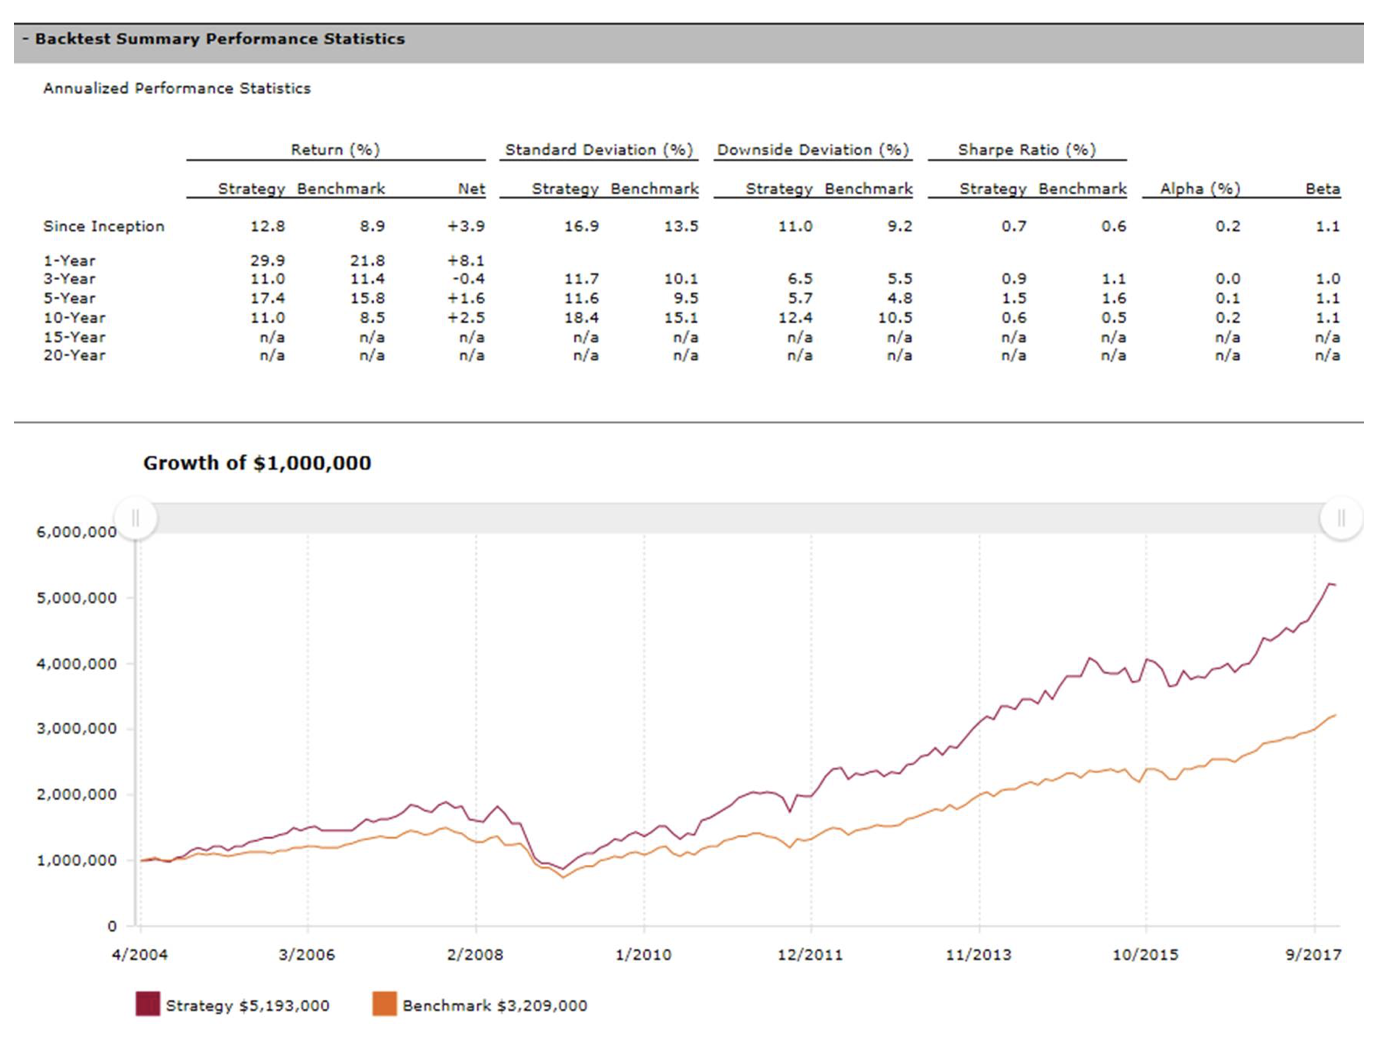 Additionally, the return distribution of the portfolio are shown here:
 The stocks that qualify for purchase into the strategy today are listed in the table below. As always, it is advised that investors conduct their own independent research before buying or selling any security.
| Rank | Symbol | Company | Morningstar Sector | Market Cap ($USD Millions) | Return on Invested Capital (%) | 5Y EPS Growth Rate (%) | 3M Estimate Revision (%) | Enterprise Value/EBITDA | Debt to Equity Relative to Sector Median* | Price Change from Month End 9 Months Ago (%) | Price change from Month End 3 Months Ago (%) | Latest Earnings Surprise (%) | Dividend Yield (%) | Close Price as of January 18th, 2018 ($USD/Share) |
|---|---|---|---|---|---|---|---|---|---|---|---|---|---|---|
| 1 | MU | Micron Technology Inc | Technology | 50908.73 | 29.49 | 113.18 | 33.81 | 4.23 | 0.65 | 58.98 | -0.72 | 8.52 | 0 | 43.99 |
| 2 | KORS | Michael Kors Holding | Consumer Cyclical | 9886.63 | 38.24 | 17.56 | 9.32 | 9.36 | 0 | 74.15 | 33.19 | 20.06 | 0 | 65.01 |
| 3 | ROST | Ross Stores Inc | Consumer Cyclical | 31202.22 | 46.52 | 12.94 | 2.59 | 13.81 | 0.17 | 25.62 | 28.6 | 3.9 | 0.78 | 81.65 |
| 4 | NVDA | NVIDIA Corporation | Technology | 134664 | 40.19 | 60.55 | 19.23 | 45.9 | 0.62 | 115.19 | 8.52 | 14.47 | 0.27 | 224.44 |
| 5 | TGT | Target Corporation | Consumer Defensive | 42344.3 | 11.19 | 5.94 | 22.67 | 7.67 | 1.05 | 39.48 | 31.94 | 3.69 | 3.18 | 77.9 |
| 6 | TXN | Texas Instruments Inc | Technology | 114729.12 | 32.11 | 22.98 | 0.11 | 16.56 | 0.56 | 47.02 | 20.4 | 5.47 | 2.13 | 116.41 |
| 7 | BIIB | Biogen | Healthcare | 72841.1 | 26.46 | 31.1 | 1.12 | 10.68 | 0.79 | 27 | 10.52 | 3.63 | 0 | 344.44 |
| 8 | LRCX | Lam Research Corp | Technology | 33271.85 | 25.36 | 50.49 | 0.9 | 13.47 | 0.49 | 41.84 | -1.5 | 2.04 | 0.97 | 205.45 |
| 9 | LUV | Southwest Airlines Co | Industrials | 38605.79 | 13.13 | 56.41 | 5.49 | 9.03 | 0.43 | 15.72 | 20.79 | 1.04 | 0.77 | 65.06 |
| 10 | TSCO | Tractor Supply Co | Consumer Cyclical | 10158.16 | 21.03 | 12.51 | 3.67 | 12.88 | 0.46 | 30.67 | 34.25 | 2.04 | 1.34 | 80.9 |
| 11 | GPS | Gap Inc | Consumer Cyclical | 13127.81 | 19.9 | -5.69 | 3.26 | 7.29 | 0.5 | 28.86 | 29.9 | 3.46 | 2.73 | 33.76 |
| 12 | PAYX | Paychex Inc | Industrials | 24751.47 | 40.61 | 9.02 | 0.21 | 17.3 | 0 | 16.24 | 8.03 | 0.36 | 2.9 | 68.91 |
| 13 | AMG | Affiliated Managers Grp | Financial Services | 11412.08 | 15.91 | 10.38 | 4.57 | 8.48 | 0.83 | 23.99 | 10.09 | 0.5 | 0.39 | 205.32 |
| 14 | HUM | Humana Inc | Healthcare | 39920.83 | 22.52 | 6.69 | 0.2 | 9.71 | 0.61 | 25.89 | 9.43 | 2.51 | 0.57 | 279.44 |
| 15 | CBG | CBRE Group, Inc. | Real Estate | 15340.16 | 12.54 | 18.68 | 4.35 | 10.18 | 0.7 | 26.19 | 14.93 | 5.79 | 0 | 45.19 |
| 16 | VLO | Valero Energy Corp | Energy | 42209.1 | 6.28 | -2.76 | 13.31 | 8.8 | 0.72 | 49.3 | 22.27 | 1.55 | 2.9 | 96.46 |
| 17 | EXPD | Expeditors Intl of Wash | Industrials | 11744.38 | 26.61 | 10.39 | 3.14 | 16.08 | 0 | 17.83 | 13.21 | 3.67 | 1.27 | 66.09 |
| 18 | CHRW | CH Robinson Worldwide | Industrials | 13059.49 | 17.92 | 7.48 | 9.03 | 17.05 | 0.73 | 28.86 | 19.29 | 0.07 | 1.96 | 93.68 |
| 19 | AET | Aetna Inc | Healthcare | 60488.29 | 11.89 | 12.73 | 0.99 | 10.54 | 0.89 | 37.33 | 9.09 | 5.32 | 1.08 | 185.49 |
| 20 | ALGN | Align Technology Inc | Healthcare | 21704.1 | 30.23 | 19.61 | 2.31 | 63.65 | 0 | 101.08 | 13.27 | 8.22 | 0 | 270.7 |
Share this article Share on Facebook Share on Twitter Share on Linkedin Share on Reddit Share on Email

Tax season can push Canadians deeper into debt as many rely on refunds. Here’s why it’s happening, and how...

The first quarter finally broke the pattern of steadily rising markets, but energy stocks soared.

Robert has been taking RRIF withdrawals beyond the minimum required amount to gift to his kids and to reinvest...

Geopolitics, rising oil prices and ETF inflows are shaping Bitcoin’s outlook. Is now the right time for Canadian investors...

Wealthsimple's direct indexing brings a tax-saving investing strategy to a wider group of investors, but the number likely to...

A University of Calgary study found that over one-third of senior homeowners worry about affording basic home maintenance, suggesting...

Find the best GIC rates in Canada. Plus, everything you need to know about how they work.

Whether you want the highest interest rate or no service fees, these savings accounts will meet your needs.

Which ETFs should you invest in? Which ones best suit your risk tolerance? What about personal ethics? Check out...