Do you need market-neutral ETFs in your portfolio?
A data-driven look at how various alternative-strategy ETFs have performed in recent years and where they fit into your investment mix, if at all.
Advertisement
A data-driven look at how various alternative-strategy ETFs have performed in recent years and where they fit into your investment mix, if at all.

In August 2025, I wrote about a concept that started gaining traction among financial advisors: the 40-30-30 portfolio. This allocation emerged in the aftermath of the 2022 bear market, when rising inflation and aggressive interest-rate hikes caused both stocks and bonds to decline at the same time. That challenged the traditional balanced portfolio and pushed advisors to look for alternatives.
The idea is to reduce exposure to stocks and bonds and allocate a larger portion to alternative assets. Those alternatives can take many forms. Some investors turn to hard assets or digital stores of value like gold or cryptocurrencies. Others look at private markets, including private equity, private credit, and real estate.
Then there is a third category that tends to get less attention but is increasingly accessible: hedge fund-like alternative or market-neutral strategies designed to generate returns with low correlation to traditional assets.
Since early 2019, regulatory changes in Canada have expanded access to liquid alternatives in both mutual fund and ETF format. Today, Canadian investors have a small but growing set of options.

Earn 1.50% tax-free on your cash savings.

Earn a guaranteed 3.50% in your TFSA when you lock in for 1 year.

Open your TFSA with one of the best online brokers in Canada. See our ranking.
MoneySense is an award-winning magazine, helping Canadians navigate money matters since 1999. Our editorial team of trained journalists works closely with leading personal finance experts in Canada. To help you find the best financial products, we compare the offerings from over 12 major institutions, including banks, credit unions and card issuers. Learn more about our advertising and trusted partners.
Using the Cboe Canada ETF screener, you can currently find six market-neutral ETFs available, with assets ranging from just a few million dollars for the Fidelity Market Neutral Alternative Fund (FMNA) to over $500 million for larger offerings like the Picton Market Neutral Equity Fund (PFMN).
The timing is helpful. Many of these funds launched shortly after the regulatory changes, which means we now have several years of performance data to look back on. That includes periods of market stress like the March 2020 COVID-19 crash and the 2022 bear market. The question to ask now is, “Have these strategies actually delivered on their promise of diversification?”
To answer that, we will look at how market-neutral ETFs work, examine the three largest options available in Canada, and review what the data says about their role alongside traditional stock and bond allocations.
A market-neutral strategy falls under the broader category of alternative investing, meaning it goes beyond simply buying and holding stocks or bonds. Instead of relying on markets to rise over time, these strategies aim to generate returns regardless of overall market direction.
The reason this structure exists is that stock returns are driven by more than just company fundamentals. Broader forces such as interest-rate changes, economic growth, credit conditions, and overall market sentiment can move large groups of stocks in the same direction. Even a strong company can decline if the broader market is under pressure, for example.
Market-neutral strategies aim to minimize that effect. By balancing long and short positions, they attempt to offset market-wide movements and isolate more specific sources of risk and return. For example, a manager may be bullish on a particular sector, such as U.S. energy, but recognize that a broad market downturn could still pull those stocks lower. In that case, they might go long selected energy companies while shorting a broader market index to hedge out general market risk.
The objective is to offer an investment with a beta close to zero, meaning it has little sensitivity to overall market movements. If successful, the returns generated would come primarily from the relative performance of the long and short positions rather than from whether the market rises or falls.
One thing to recognize with market-neutral strategies is the level of discretion involved. These are not rules-based index products. Portfolio managers are making active decisions on what to buy and what to short, often supported by proprietary quantitative models. The specifics of those models are not fully disclosed, which can make them feel like a “black box” to investors. That said, ETF providers still offer a general framework for how their strategies work.
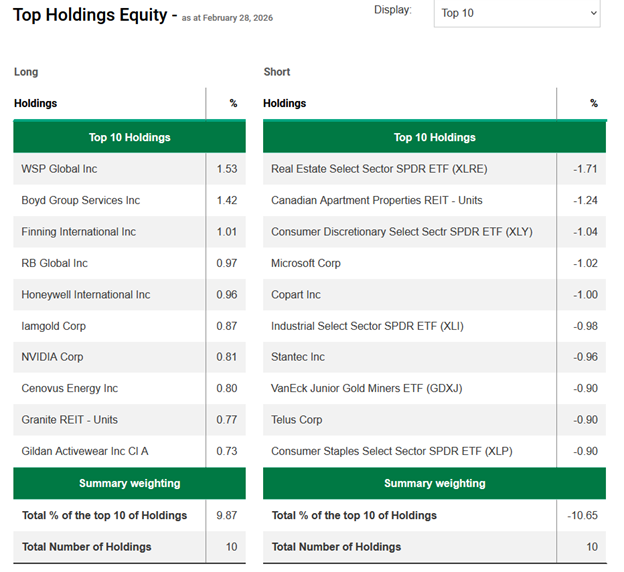
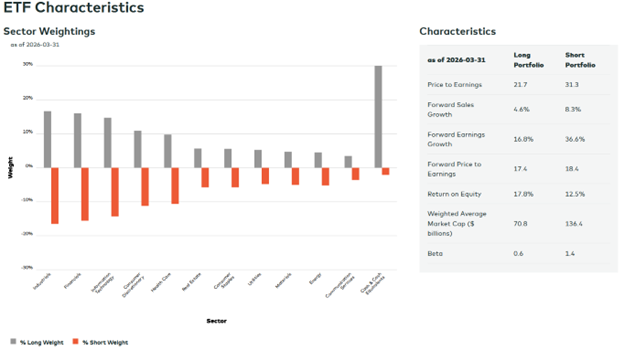
Take PFMN, the largest Canadian market-neutral ETF. It runs 100% long equity exposure and 100% short equity exposure. The goal is to offset market movements and maintain an overall beta close to zero, meaning returns should be largely independent of the broader equity market.
The fund provides transparency around its long and short exposures, including sector and geographic differences between the two sides of the portfolio.
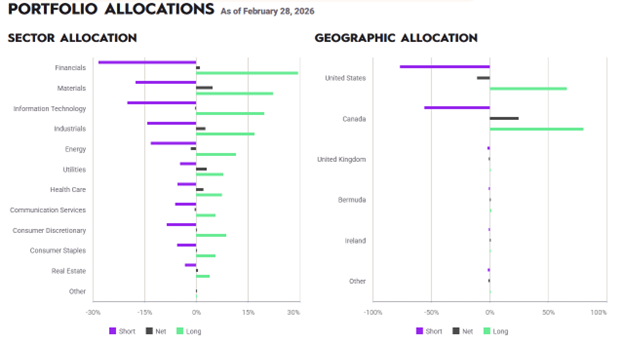
Source: Picton Investments
A similar strategy can be seen in the Desjardins Alt Long/Short Equity Market Neutral (DANC), which also uses a long/short equity approach designed to neutralize market exposure.
Source: Desjardins
By contrast, the AGF U.S. Market Neutral Anti-Beta CAD-Hedged ETF (QBTL) takes a slightly different approach by explicitly targeting negative beta. Instead of aiming for zero correlation to the market, a negative beta implies that the fund is designed to move in the opposite direction of the market, at least to some degree. It does this by going long low-beta U.S. stocks, which tend to be more defensive, and shorting high-beta stocks, which tend to be more sensitive to market swings, all on a dollar-neutral basis.
Source: AGF Investments
As you might expect, these strategies come at a cost. Fees for market-neutral ETFs are typically much higher and more complex than what you would see with index ETFs. It is not always as simple as looking at the management expense ratio.
For example, DANC carries a management expense ratio of 1.17%. QBTL appears cheaper at first glance, with a 0.55% management expense ratio, but also reports an additional trading expense ratio of roughly 2.2%, which materially increases the total cost.
PFMN is the most complex of the group. It charges a base management fee of 0.95%, along with a 20% performance fee on returns above a 2% hurdle rate, subject to a high-water mark. This means the manager takes a share of profits once returns exceed a minimum threshold, but only after any prior losses have been recovered. While this aligns incentives to some extent, it also makes the total cost variable and harder to predict from year to year.
You can still get a sense of the total cost of ownership by looking at trailing figures. As of its June 2025 fact sheet, PFMN reported a total management expense ratio of 4.27%. All in, these are significantly more expensive than traditional tools used to reduce portfolio risk, such as bond ETFs or cash-like ETFs. So, are they worth it for retail investors?
To test whether these strategies deliver on their promise, I ran a simple comparison using data from PortfolioVisualizer.com. As a baseline, I used the Vanguard Growth ETF Portfolio (VGRO), a low-cost, globally diversified mix of roughly 80% equities and 20% bonds with a Canadian home bias.
Against that, I built three comparable portfolios. Each held 80% in the iShares MSCI World Index ETF (XWD) as a proxy for global equities. The remaining 20%, instead of going into aggregate bonds, was allocated to a single market-neutral ETF in each case: DNNC, PFMN, and QBTL. The back-test period covered January 2020 through March 2026, with annual rebalancing. Importantly, all of these results are net of fees. The relatively high costs of these ETFs were already factored into the performance. The results are summarized in the table below:
| Portfolio performance statistics | ||||
| Metric | 80/20 XWD/DANC | 80/20 XWD/PFMN | 80/20 XWD/QBTL | Vanguard Growth Portfolio |
| Start balance | $10,000 | $10,000 | $10,000 | $10,000 |
| End balance | $18,734 | $20,055 | $17,517 | $18,187 |
| Annualized return (CAGR) | 10.57% | 11.78% | 9.38% | 10.04% |
| Standard deviation | 10.28% | 10.63% | 8.72% | 11.36% |
| Best year | 23.64% | 25.48% | 24.91% | 19.30% |
| Worst year | -9.18% | -8.18% | -5.08% | -11.19% |
| Maximum drawdown | -14.65% | -14.51% | -11.54% | -16.08% |
| Sharpe ratio | 0.80 | 0.88 | 0.81 | 0.69 |
Source: Portfolio Visualizer
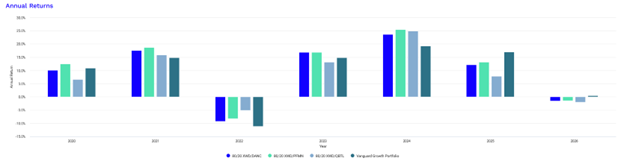
What stands out is that, with the exception of QBTL, the portfolios that included DNNC and PFMN delivered higher raw annualized returns than VGRO over this period. QBTL lagged on total return, but that is not entirely surprising given its negative beta design.
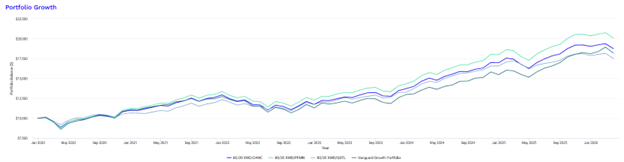
Source: Portfolio Visualizer
Where all three strategies did stand out was on a risk-adjusted basis. Each produced a higher Sharpe ratio than VGRO, indicating more return per unit of risk. Volatility, measured by standard deviation, was also lower across all three portfolios.
Looking at extremes, the differences were also notable. All three combinations posted stronger best-year returns while experiencing less severe losses in their worst years.
Source: Portfolio Visualizer
Maximum drawdowns were reduced across the board. QBTL, despite its lower overall return, performed particularly well on downside protection, which aligns with its negative-beta objective.
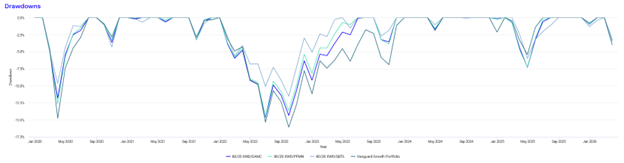
Source: Portfolio Visualizer
With the benefit of hindsight, all three ETFs have done what they set out to do. Over a period that included the COVID-19 crash and the 2022 drawdown where both stocks and bonds struggled, these strategies generally held up well and provided diversification when it was most needed.
Historically, these market-neutral ETFs have absolutely offered diversification benefits, but they did so at great cost. Higher fees act as a persistent headwind, especially over the long term.
There is also a tendency among both advisors and investors to fight the last battle. The past several years have been unusually volatile, with multiple stress events that played to the strengths of alternative strategies. There is no guarantee the next market environment will look the same.
Another factor to keep in mind is style drift and model risk. Unlike index ETFs, these strategies rely on active decisions or quantitative models that can evolve over time. A model that worked in one market regime may stop working in another, and managers may adjust exposures in ways that are not always obvious to investors, until the ETF doesn’t perform as expected.
There is also key-person risk. If a strategy depends heavily on a specific team or star portfolio manager, changes in personnel from retirement or death can materially affect outcomes. Over long periods, this can introduce another layer of uncertainty on top of already higher fees.
For investors who prioritize simplicity, low costs, and transparency, traditional index-based portfolios still make a strong case. But this is also a reminder that not every alternative product is inherently flawed or a scam. Some do serve a purpose and can improve portfolio outcomes under certain conditions.
The key is to approach them with clear expectations. Understand how they work, what they cost, and what role they are meant to play. For some investors, that trade-off may be worth it. For others—including myself—the added complexity and fees still outweigh the benefits.
Share this article Share on Facebook Share on Twitter Share on Linkedin Share on Reddit Share on Email

Whether a U.S.-listed ETF is worth buying depends on foreign exchange costs, taxes, MERs, and your investment account.

Artificial intelligence is transforming markets, but retirees should approach the AI investing theme with caution and a well-diversified portfolio.

After learning Canada's financial system from the ground up, Chexy co-founder Liza Akhvledziani shares the money habits that helped...

The analog economy is booming, but Gen Z isn't chasing nostalgia. Here's why younger consumers are paying more for...

Cell phone related expenses may be deductible for some taxpayers, even if they were missed in the past.

Why and how ETF closures happen, which warning signs to watch for, and what it means if a fund...

Canada's top finfluencers share how they built trust, grew audiences and navigate increasing regulatory scrutiny in a rapidly maturing...

Incorporating can eliminate the need to pay CPP contributions if you are self-employed but there are trade-offs that should...

Putting an inheritance into a joint account may seem simple, but tax and attribution rules can affect who reports...

A U.S.-Iran ceasefire has eased oil prices and inflation fears. Here's what that could mean for bitcoin prices and...