Are you ready for the Hot Potato?
Love the steady returns of the classic Couch Potato strategy? This spicier version beat it by 6.7 percentage points annually. It’s hot stuff
Advertisement
Love the steady returns of the classic Couch Potato strategy? This spicier version beat it by 6.7 percentage points annually. It’s hot stuff
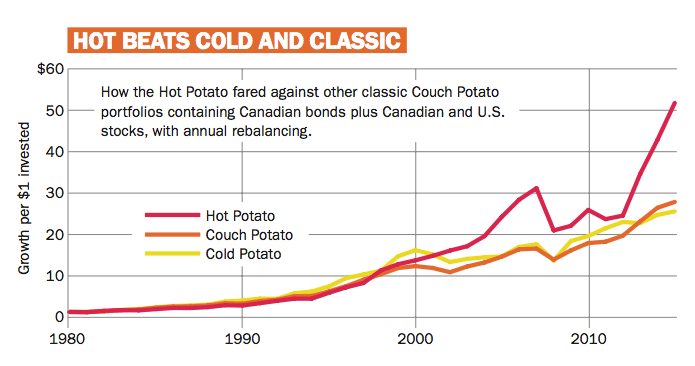
 The Global Hot Potato portfolio, rebalanced monthly, gained an average of 16.7% per year from the start of 1981 to the end of 2015. It beat the classic Couch Potato by a whopping 6.7 percentage points annually.
While the global version of the Hot Potato was certainly more volatile than the Couch Potato, it came mostly from the sort of upside volatility that few investors complain about. In addition, it nimbly sidestepped several market crashes along the way. In fact, the largest drawdown for the monthly-balanced Global Hot Potato came after the Internet bubble popped in 2000, when it declined 21.4%. But it bounced back almost two years before the Global Couch Potato did, having fallen 29.2% during the same downturn.
The Global Couch Potato drew its biggest loss during the 2008 collapse (31.1%) and didn’t recover until 2011. Its spicier sibling fared better because it was invested in bonds for a good part of that period: It fell only 10% from its 2007 high to its 2008 low, and had recovered fully by the summer of 2009.
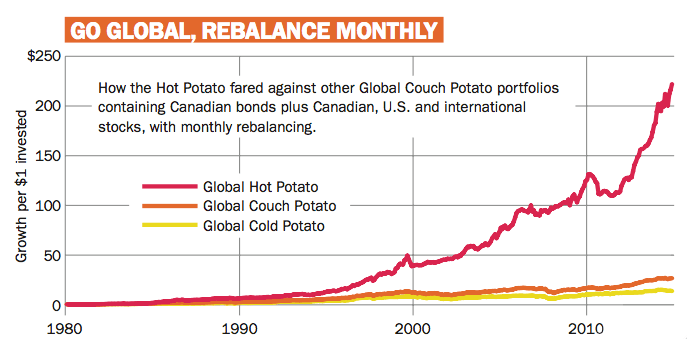
Once again contrarians fared poorly. The Global Cold Potato Portfolio is moved monthly into the worst performing asset class of the prior year. By doing so, it gained an average of 7.9% annually and trailed the Global Couch Potato by 2.1 percentage points per year. The monthly return history of all three global potato variants is shown in the charts on the opposite page.
The Global Hot Potato portfolio, rebalanced monthly, gained an average of 16.7% per year from the start of 1981 to the end of 2015. It beat the classic Couch Potato by a whopping 6.7 percentage points annually.
While the global version of the Hot Potato was certainly more volatile than the Couch Potato, it came mostly from the sort of upside volatility that few investors complain about. In addition, it nimbly sidestepped several market crashes along the way. In fact, the largest drawdown for the monthly-balanced Global Hot Potato came after the Internet bubble popped in 2000, when it declined 21.4%. But it bounced back almost two years before the Global Couch Potato did, having fallen 29.2% during the same downturn.
The Global Couch Potato drew its biggest loss during the 2008 collapse (31.1%) and didn’t recover until 2011. Its spicier sibling fared better because it was invested in bonds for a good part of that period: It fell only 10% from its 2007 high to its 2008 low, and had recovered fully by the summer of 2009.
Once again contrarians fared poorly. The Global Cold Potato Portfolio is moved monthly into the worst performing asset class of the prior year. By doing so, it gained an average of 7.9% annually and trailed the Global Couch Potato by 2.1 percentage points per year. The monthly return history of all three global potato variants is shown in the charts on the opposite page.
Share this article Share on Facebook Share on Twitter Share on Linkedin Share on Reddit Share on Email

Lululemon profits dip, Couche-Tard surges, and Power Corp declines. Here’s what investors need to know about Q4 results...

Canadian companies face a turbulent quarter, with Algoma Steel losing big and Transat posting gains amid major corporate moves.

Q4 shows mixed results across sectors: Canadian Natural and Pet Valu post gains, while George Weston and Canada Packers...
Canada’s banking sector sees higher Q1 profits and strong financial performance in the latest earnings reports.

From big profit jumps at Enbridge and Cenovus to strong holiday sales at Canadian Tire, see how major Canadian...

Manulife reports $1.5B in Q4 profit while Air Canada rebounds to $296M. See how Sun Life, Brookfield, and other...

Find out which Canadian robo-advisors offer the lowest fees, helpful support, best returns, and most account types with the...

Catch up on the past week’s biggest news for Canadian investors, with earnings results from Suncor, ATS, Brookfield, BCE,...

The first home savings account was created to help you save more money for a home purchase. Here’s how...

An earnings roundup and operational updates from key Canadian companies, including Rogers, CPKC, CGI, Cascades, and Empire Co.