Methodology
How we crunched the numbers to determine Canada's Best Places to Live.
Advertisement
How we crunched the numbers to determine Canada's Best Places to Live.
 We ranked each city against its peers and overall. A small city is defined by a population below 100,000, a mid-size city has population of between 100,000 and 400,000 and a large city has a minimum population of 400,000.
This year we added one city, Port Moody, B.C. to our ranking to bring the total number of communities we rank to 201. The only other change of note affected the new cars category. We view new car purchases as an indicator of wealth and consumer confidence. This year we added in the percentage of new luxury cars purchased to get an even better sense of what is happening within each community. To accommodate this change the percentage of new cars, which was worth two points last year, is now worth only one; the percentage of luxury cars accounts for the other point to keep the weighting of this category the same as it was in previous years.
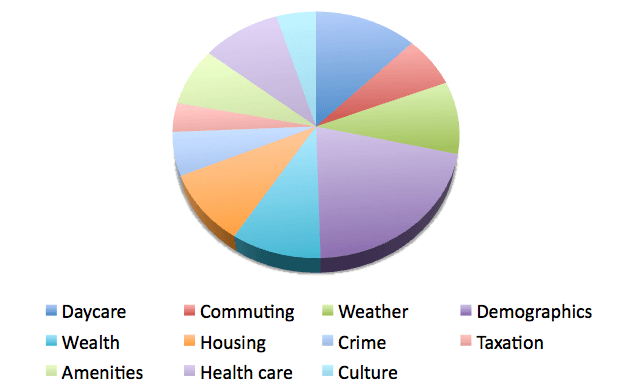
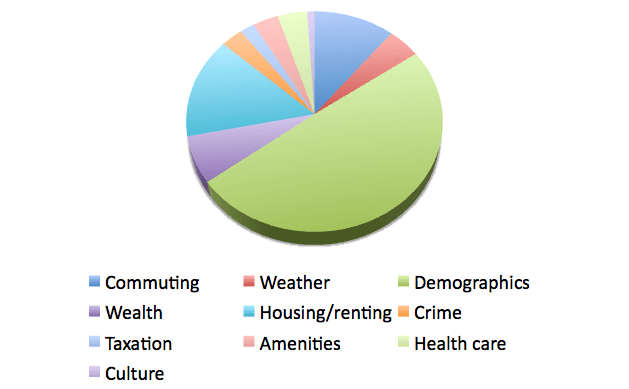
In addition to our highly popular Best Places to Live, we continue to showcase the Best Places to Raise Kids and Best Places to Retire lists, and the Best Places for New Immigrants. A full breakdown of our methodology is below.
And while MoneySense strongly believes air quality is an important variable in determining the quality of life within a city, we unfortunately had to drop this category from our ranking system because we were unable to find reliable and current data for each city.
The calculations
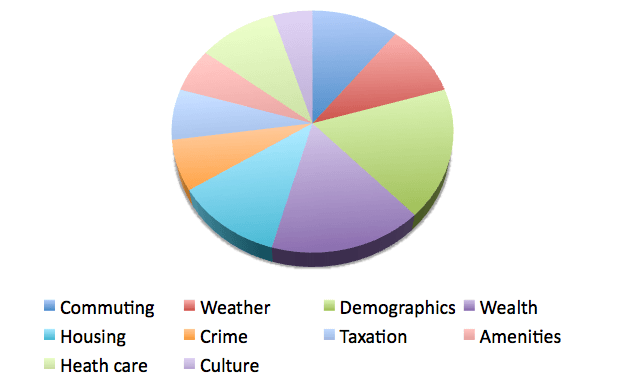
A total of 103 points was up for grabs. Each category (below) was allotted a number of points depending on the importance of the category. For example, employment statistics are worth 10 points while sales taxes are worth 1 point. Some categories are further broken into subcategories. For example, the crime category is determined by statistics in the subcategories of violent crime, crime severity and total crime.
The top city in each category received the maximum number of points, and the rest of the cities received descending incremental points based on their ranking.
For example, in the area of unemployment, Cold Lake, Alta. had the lowest unemployment rate in the country (3.4%). It was ranked No. 1 in that category and received 10 points. The second-best city in the unemployment category, Boucherville, Que., received 9.95 points. The next city was Lévis, Que. with 9.90 points and so on, down to the 201th city (Campbellton on the New Brunswick/Quebec border. with an unemployment rate of 17.4%), which received no points.
Calculations for some other categories follow a slightly different methodology. For example, in the category of population growth over the past five years, an annual rate of 8.2% was considered ideal. Anything below or above that rate loses points and cities with a population loss receive zero. The same is true for the subcategory of precipitation, which makes up part of the weather category. (The ideal number is 700 mm a year, with anything above or below that level losing points accordingly.) As well, 5 points were awarded on the percentage of people employed in arts, culture, recreation and sports.
Here’s an example of how the scoring system works:
We ranked each city against its peers and overall. A small city is defined by a population below 100,000, a mid-size city has population of between 100,000 and 400,000 and a large city has a minimum population of 400,000.
This year we added one city, Port Moody, B.C. to our ranking to bring the total number of communities we rank to 201. The only other change of note affected the new cars category. We view new car purchases as an indicator of wealth and consumer confidence. This year we added in the percentage of new luxury cars purchased to get an even better sense of what is happening within each community. To accommodate this change the percentage of new cars, which was worth two points last year, is now worth only one; the percentage of luxury cars accounts for the other point to keep the weighting of this category the same as it was in previous years.
In addition to our highly popular Best Places to Live, we continue to showcase the Best Places to Raise Kids and Best Places to Retire lists, and the Best Places for New Immigrants. A full breakdown of our methodology is below.
And while MoneySense strongly believes air quality is an important variable in determining the quality of life within a city, we unfortunately had to drop this category from our ranking system because we were unable to find reliable and current data for each city.
The calculations
A total of 103 points was up for grabs. Each category (below) was allotted a number of points depending on the importance of the category. For example, employment statistics are worth 10 points while sales taxes are worth 1 point. Some categories are further broken into subcategories. For example, the crime category is determined by statistics in the subcategories of violent crime, crime severity and total crime.
The top city in each category received the maximum number of points, and the rest of the cities received descending incremental points based on their ranking.
For example, in the area of unemployment, Cold Lake, Alta. had the lowest unemployment rate in the country (3.4%). It was ranked No. 1 in that category and received 10 points. The second-best city in the unemployment category, Boucherville, Que., received 9.95 points. The next city was Lévis, Que. with 9.90 points and so on, down to the 201th city (Campbellton on the New Brunswick/Quebec border. with an unemployment rate of 17.4%), which received no points.
Calculations for some other categories follow a slightly different methodology. For example, in the category of population growth over the past five years, an annual rate of 8.2% was considered ideal. Anything below or above that rate loses points and cities with a population loss receive zero. The same is true for the subcategory of precipitation, which makes up part of the weather category. (The ideal number is 700 mm a year, with anything above or below that level losing points accordingly.) As well, 5 points were awarded on the percentage of people employed in arts, culture, recreation and sports.
Here’s an example of how the scoring system works:
| Red Deer, Alta.. | ||||
| Travel to Work by Bicycle % | Travel to Work by Walking % | Travel to Work by Public Transit % | Labour Force Unemployment Rate Score | |
| Points earned | 1.86 | 0.95 | 3.13 | 7.25 |
| Avail. points | 3.00 | 3.00 | 5.00 | 10.00 |
| Annual Rain Fall (mm) | Number of Days with Rain | % of Days with Precipitation (Rain or Snow) | Number of Days w/ min. Temp Above 0C Score | Number of Days w/ min. Temp Above 20C Score |
| 0.69 | 2.61 | 0.88 | 0.09 | 0.26 |
| 2.00 | 3.00 | 1.00 | 3.00 | 1.00 |
| Average Value of Primary Real Estate Score | Average Time to Buy a Home Rank | Average Household Income Score | Average Household Discretionary Income Score | Average Household Net Worth Score |
| 3.24 | 4.80 | 3.90 | 4.23 | 3.38 |
| 6.00 | 6.00 | 5.00 | 5.00 | 5.00 |
| % change in Population ’08 to ’13 Score | 5 year Change in Crime Rate per 100,000 Score | Crime per 100,000 Score | Violent Crime Severity Index Score | Crime Severity Index Score |
| 3.56 | 0.01 | 0.18 | 0.13 | 0.10 |
| 8.00 | 1.00 | 2.00 | 2.00 | 2.00 |
| Total Sales Taxes Score | Income Tax on $50,000 Score | Property Tax (%) Score | Average Property tax as a % of Household Income Score | % New Cars 2011 Model Year and Up/% Luxury Cars Score |
| 1.00 | 1.67 | 0.89 | 0.42 | 0.50 |
| 1.00 | 3.00 | 2.00 | 1.00 | 1.00/1.00 |
| Doctors per ‘000 Score | % Employed in Health Care Sector Score | Number of Doctors of Medicine Offices per ‘000 Score | % Employed in Art, Culture, Recreation, Sport score | Hospital |
| 2.45 | 3.46 | 0.92 | 3.00 | 2 |
| 5.00 | 4.00 | 1.00 | 5.00 | 2 |
| College | University | Movie Theatre | Prox. to Major Airport | FINAL |
| 1 | 0 | 0.5 | 1.5 | 61.12 |
| 1 | 1 | 0.5 | 1.5 | 103.00 |
| WEATHER | 20 |
| PROPERTY TAX | 6 |
| SALES TAX | 1 |
| INCOME TAXES | 3 |
| CULTURE | 5 |
| CRIME | 7 |
| HEALTH CARE | 16 |
| TRANSIT | 5 |
| HOSPITAL | 4 |
| WALK/RIDE | 6 |
| PROXIMITY TO AN AIRPORT | 2 |
| NEW CAR | 1 |
| THEATRE | 1 |
| POPULATION GROWTH | 8 |
| NET WORTH | 5 |
| HOUSING | 10 |
| TOTAL | 100 |
| WALK/RIDE TO WORK | 6 |
| TRANSIT | 5 |
| WEATHER | 4.5 |
| POPULATION GROWTH | 2 |
| UNEMPLOYMENT | 8 |
| HOUSING | 4 |
| HOUSEHOLD INCOME | 3 |
| DISCRETIONARY INCOME | 2 |
| HOUSEHOLD NET WORTH | 2 |
| CRIME | 3 |
| SALES TAXES | 1 |
| INCOME TAXES | 1 |
| DOCTORS PER 1,000 | 2 |
| HEALTH PROFSESIONARL | 1 |
| DOC OFF | 1 |
| UNIVERSITY | 0.5 |
| COLLEGE | 0.5 |
| CULTURE | 1 |
| PROXIMITY TO AN AIRPORT | 1.5 |
| LANGUAGE DIVERSITY | 10 |
| IMMIGRATION POPULULATION | 30 |
| AFFORDABLE RENT (1-BEDROOM APPARTMENT) | 5 |
| RENTAL VACANCIES | 5 |
| TOTAL | 101 |
Share this article Share on Facebook Share on Twitter Share on Linkedin Share on Reddit Share on Email

Know your home’s true value before refinancing. A professional appraisal helps you access equity, lower payments, and make smarter...

The Bank of Canada holds its key rate at 2.25%, keeping variable mortgage rates and savings returns steady amid...

If you leave Canada and own a rental property, or you are a non-resident and you buy a rental...

Rental property investors need to report their annual income and expenses on their tax return. You must also track...

Parents can help their kids buy a first home without risking their own finances. Explore smart strategies, from FHSAs...

Short answer: Yes. But to take advantage of this amazing tax shelter, you need to understand the CRA’s rules...

The Bank of Canada holds its benchmark rate at 2.25%, impacting variable mortgages, fixed rates, and savings as economic...

Canada’s rental market is shifting: falling rents, more supply, and new perks give renters more choice and bargaining power...

Is rent from a family member or common-law partner taxable? Learn when it counts as income, what expenses you...

Learn why market price and appraised value of your home often differ—and which number matters when selling, refinancing, or...