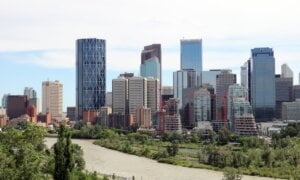
Calgary neighbourhoods: Full ranking
See where your neighbourhood ranks
Advertisement
Advertisement
By Mark Brown and Romana King on April 11, 2017
By Mark Brown and Romana King on April 11, 2017
See where your neighbourhood ranks
Advertisement
| Rank | Neighbourhood | Area | Average price | Average price vs. area | Average price vs. metro district | Average price vs. greater city area | Value | 1-year price change | 3-year price change | 5-year price change | Momentum | Realtor grade |
|---|---|---|---|---|---|---|---|---|---|---|---|---|
| 1 | Albert Park/Radisson Heights | East | $343,808 | 96.6% | 61.7% | 68.5% | -2.00% | 16.39% | 27.8% | ★★½ | ||
| 2 | Martindale | Northeast | $360,550 | 92.4% | 64.7% | 71.8% | -0.32% | 18.12% | 34.5% | ★★ | ||
| 3 | Castleridge | Northeast | $337,258 | 86.4% | 60.5% | 67.2% | -1.90% | 18.13% | 36.5% | ★★ | ||
| 4 | Southview | East | $380,058 | 106.8% | 68.2% | 75.7% | -1.40% | 14.62% | 31.6% | ★★½ | ||
| 5 | Falconridge | Northeast | $331,367 | 84.9% | 59.4% | 66.0% | -2.32% | 18.68% | 36.8% | ★★ | ||
| 6 | Marlborough Park | Northeast | $398,708 | 102.1% | 71.5% | 79.4% | 2.56% | 22.90% | 44.6% | ★★ | ||
| 7 | Pineridge | Northeast | $394,067 | 101.0% | 70.7% | 78.5% | 1.35% | 21.56% | 45.7% | ★★ | ||
| 8 | Abbeydale | Northeast | $337,150 | 86.4% | 60.5% | 67.1% | -2.87% | 19.35% | 35.4% | ★★ | ||
| 9 | Taradale | Northeast | $398,075 | 102.0% | 71.4% | 79.3% | -1.50% | 16.41% | 34.4% | ★★ | ||
| 10 | Haysboro | South | $470,667 | 98.3% | 84.4% | 93.7% | -0.06% | 11.48% | 23.5% | ★★★½ | ||
| 11 | Skyview Ranch | Northeast | $410,733 | 105.2% | 73.7% | 81.8% | -3.10% | 17.51% | 25.5% | ★★★ | ||
| 12 | Country Hills | North | $415,717 | 93.8% | 74.6% | 82.8% | -0.74% | 11.99% | 21.6% | ★★★ | ||
| 13 | Coventry Hills | North | $434,458 | 98.0% | 77.9% | 86.5% | -1.43% | 12.42% | 24.5% | ★★★ | ||
| 14 | Dover | East | $350,100 | 98.3% | 62.8% | 69.7% | -2.70% | 20.84% | 40.6% | ★★ | ||
| 15 | Forest Heights | East | $330,983 | 93.0% | 59.4% | 65.9% | -1.51% | 13.38% | 30.0% | ★½ | ||
| 16 | Fairview | South | $410,283 | 85.7% | 73.6% | 81.7% | -0.43% | 9.20% | 19.7% | ★★★ | ||
| 17 | McKenzie Towne | Southeast | $424,175 | 94.7% | 76.1% | 84.5% | -4.50% | 9.49% | 22.3% | ★★★½ | ||
| 18 | Harvest Hills | North | $454,908 | 102.6% | 81.6% | 90.6% | -0.89% | 13.68% | 26.1% | ★★★ | ||
| 18 | Whitehorn | Northeast | $361,408 | 92.6% | 64.8% | 72.0% | -3.92% | 12.02% | 28.4% | ★★ | ||
| 20 | Kingsland | South | $473,492 | 98.9% | 84.9% | 94.3% | -0.29% | 11.41% | 23.7% | ★★★ | ||
| 21 | Tuscany | Northwest | $550,558 | 101.1% | 98.8% | 109.6% | -2.03% | 14.02% | 38.0% | ★★★½ | ||
| 22 | Bowness | Northwest | $348,367 | 64.0% | 62.5% | 69.4% | -3.31% | 7.76% | 18.2% | ★★★ | ||
| 23 | Monterey Park | Northeast | $415,033 | 106.3% | 74.4% | 82.6% | -3.30% | 15.62% | 33.9% | ★★½ | ||
| 24 | Rundle | Northeast | $380,883 | 97.6% | 68.3% | 75.8% | -2.17% | 10.59% | 25.4% | ★★ | ||
| 25 | Marlborough | Northeast | $366,975 | 94.0% | 65.8% | 73.1% | -2.44% | 11.64% | 28.5% | ★★ | ||
| 26 | MacEwan Glen | North | $443,483 | 100.1% | 79.6% | 88.3% | -0.35% | 12.31% | 22.9% | ★★★ | ||
| 27 | Vista Heights | Northeast | $361,933 | 92.7% | 64.9% | 72.1% | -2.42% | 11.20% | 17.8% | ★★½ | ||
| 28 | Forest Lawn | East | $328,992 | 92.4% | 59.0% | 65.5% | -2.11% | 14.51% | 28.3% | ★½ | ||
| 28 | Hidden Valley | North | $456,150 | 102.9% | 81.8% | 90.8% | 0.06% | 14.31% | 21.4% | ★★★ | ||
| 30 | Temple | Northeast | $365,725 | 93.7% | 65.6% | 72.8% | -3.74% | 10.68% | 26.9% | ★★ | ||
| 31 | Inglewood | City Centre | $516,767 | 79.0% | 92.7% | 102.9% | -0.82% | 10.62% | 22.4% | ★★★½ | ||
| 32 | Applewood Park | East | $421,475 | 118.4% | 75.6% | 83.9% | -2.88% | 18.32% | 38.2% | ★★ | ||
| 33 | Ogden | Southeast | $343,650 | 76.7% | 61.6% | 68.4% | -2.61% | 13.31% | 22.7% | ★★ | ||
| 34 | Bridgeland/Riverside | City Centre | $575,333 | 87.9% | 103.2% | 114.6% | 0.88% | 16.22% | 28.0% | ★★★½ | ||
| 35 | Ramsay | City Centre | $476,075 | 72.7% | 85.4% | 94.8% | 0.46% | 9.12% | 22.4% | ★★★ | ||
| 36 | Huntington Hills | North | $398,967 | 90.0% | 71.6% | 79.4% | -2.62% | 8.04% | 18.7% | ★★★ | ||
| 37 | Penbrooke Meadows | East | $347,858 | 97.7% | 62.4% | 69.3% | -3.77% | 16.51% | 27.7% | ★½ | ||
| 38 | Beddington Heights | North | $385,908 | 87.1% | 69.2% | 76.8% | -1.77% | 6.62% | 17.2% | ★★½ | ||
| 38 | Silver Springs | Northwest | $505,442 | 92.9% | 90.7% | 100.6% | -1.58% | 9.95% | 19.7% | ★★★½ | ||
| 38 | Nolan Hill | North | $426,342 | 96.2% | 76.5% | 84.9% | -2.00% | 9.04% | 13.8% | ★★★ | ||
| 41 | Erin Woods | East | $340,842 | 95.7% | 61.1% | 67.9% | -2.80% | 15.89% | 18.8% | ★★ | ||
| 42 | Riverbend | Southeast | $431,742 | 96.4% | 77.4% | 86.0% | -5.33% | 9.94% | 24.4% | ★★★ | ||
| 43 | Montgomery | Northwest | $423,600 | 77.8% | 76.0% | 84.3% | -1.34% | 4.90% | 15.9% | ★★★ | ||
| 43 | Saddle Ridge | Northeast | $466,000 | 119.4% | 83.6% | 92.8% | -3.87% | 16.40% | 30.1% | ★★½ | ||
| 45 | Shawnessy | South | $412,408 | 86.1% | 74.0% | 82.1% | -1.97% | 7.76% | 14.9% | ★★★ | ||
| 46 | Arbour Lake | Northwest | $497,342 | 91.4% | 89.2% | 99.0% | -4.32% | 6.53% | 29.1% | ★★★ | ||
| 47 | Crescent Heights | City Centre | $545,100 | 83.3% | 97.8% | 108.5% | -2.05% | 9.24% | 19.7% | ★★★½ | ||
| 48 | Bridlewood | South | $438,342 | 91.6% | 78.6% | 87.3% | -2.82% | 9.43% | 20.0% | ★★½ | ||
| 49 | Bonavista Downs | South | $424,775 | 88.7% | 76.2% | 84.6% | 1.28% | 7.81% | 7.3% | ★★★ | ||
| 50 | Evanston | North | $475,025 | 107.2% | 85.2% | 94.6% | -1.69% | 6.42% | 17.7% | ★★★ | ||
| 51 | Copperfield | Southeast | $435,250 | 97.2% | 78.1% | 86.7% | -4.22% | 6.94% | 18.7% | ★★★ | ||
| 52 | New Brighton | Southeast | $474,183 | 105.9% | 85.1% | 94.4% | -4.66% | 7.62% | 21.4% | ★★★½ | ||
| 53 | Sandstone Valley | North | $478,592 | 108.0% | 85.9% | 95.3% | -0.53% | 10.24% | 20.6% | ★★½ | ||
| 54 | Thorncliffe | North | $416,617 | 94.0% | 74.7% | 83.0% | -3.42% | 3.44% | 16.5% | ★★★ | ||
| 55 | Walden | South | $379,383 | 79.2% | 68.1% | 75.5% | -2.39% | 9.10% | 1.3% | ★★★ | ||
| 56 | Acadia | South | $433,158 | 90.5% | 77.7% | 86.2% | 0.37% | 5.74% | 9.6% | ★★★ | ||
| 56 | Meadowlark Park | City Centre | $636,058 | 97.2% | 114.1% | 126.6% | -0.31% | 15.02% | 35.5% | ★★★ | ||
| 58 | Panorama Hills | North | $566,383 | 127.8% | 101.6% | 112.8% | -1.18% | 10.32% | 24.0% | ★★★ | ||
| 59 | Charleswood | Northwest | $542,392 | 99.6% | 97.3% | 108.0% | -3.18% | 3.27% | 21.5% | ★★★★ | ||
| 60 | Banff Trail | City Centre | $565,108 | 86.4% | 101.4% | 112.5% | -2.25% | 6.45% | 27.5% | ★★★½ | ||
| 60 | Coach Hill | West | $608,108 | 87.2% | 109.1% | 121.1% | 0.28% | 10.77% | 25.7% | ★★★ | ||
| 62 | Glamorgan | West | $521,375 | 74.8% | 93.5% | 103.8% | -6.62% | 9.82% | 26.1% | ★★★½ | ||
| 63 | McKenzie Lake | Southeast | $484,675 | 108.2% | 86.9% | 96.5% | -5.19% | 6.33% | 18.2% | ★★★★ | ||
| 64 | North Haven Upper | North | $509,442 | 114.9% | 91.4% | 101.4% | -4.85% | 8.72% | 24.1% | ★★★ | ||
| 65 | Willow Park | South | $586,142 | 122.4% | 105.1% | 116.7% | 2.71% | 13.06% | 18.0% | ★★★½ | ||
| 65 | North Haven | North | $480,733 | 108.5% | 86.2% | 95.7% | -5.33% | 6.11% | 23.6% | ★★★ | ||
| 67 | Ranchlands | Northwest | $426,592 | 78.4% | 76.5% | 84.9% | -4.33% | 8.48% | 21.0% | ★★½ | ||
| 68 | Chinook Park | South | $681,958 | 142.4% | 122.3% | 135.8% | -0.75% | 11.11% | 28.1% | ★★★½ | ||
| 68 | Citadel | Northwest | $448,942 | 82.5% | 80.5% | 89.4% | -3.52% | 9.32% | 16.4% | ★★★ | ||
| 70 | Millrise | South | $421,883 | 88.1% | 75.7% | 84.0% | -1.91% | 5.91% | 13.3% | ★★½ | ||
| 71 | Cranston | Southeast | $491,042 | 109.6% | 88.1% | 97.8% | -5.62% | 5.39% | 22.9% | ★★★½ | ||
| 71 | Tuxedo Park | City Centre | $469,400 | 71.7% | 84.2% | 93.5% | -3.38% | 10.28% | 12.0% | ★★★ | ||
| 73 | Brentwood | Northwest | $557,700 | 102.5% | 100.0% | 111.0% | -3.93% | 7.37% | 21.1% | ★★★★ | ||
| 74 | Strathcona Park | West | $731,183 | 104.8% | 131.2% | 145.6% | -0.14% | 10.64% | 27.3% | ★★★½ | ||
| 75 | Douglasdale/Glen | Southeast | $459,125 | 102.5% | 82.4% | 91.4% | -5.85% | 4.95% | 18.7% | ★★★½ | ||
| 76 | West Springs | West | $749,533 | 107.5% | 134.5% | 149.2% | 0.26% | 9.14% | 31.4% | ★★★½ | ||
| 76 | Cedarbrae | South | $451,883 | 94.4% | 81.1% | 90.0% | -4.51% | 6.81% | 21.5% | ★★★ | ||
| 78 | Renfrew | City Centre | $536,825 | 82.0% | 96.3% | 106.9% | -2.70% | 9.30% | 19.9% | ★★★ | ||
| 79 | Hawkwood | Northwest | $507,683 | 93.3% | 91.1% | 101.1% | -5.06% | 6.15% | 27.1% | ★★★ | ||
| 79 | Coral Springs | Northeast | $532,308 | 136.4% | 95.5% | 106.0% | -5.35% | 19.95% | 36.3% | ★★½ | ||
| 79 | Southwood | South | $446,658 | 93.3% | 80.1% | 88.9% | -3.72% | 5.19% | 17.7% | ★★★ | ||
| 82 | Midnapore | South | $428,783 | 89.6% | 76.9% | 85.4% | -4.55% | 6.47% | 15.6% | ★★★ | ||
| 83 | Dalhousie | Northwest | $566,458 | 104.1% | 101.6% | 112.8% | -3.61% | 8.97% | 23.3% | ★★★½ | ||
| 84 | Queensland | South | $370,125 | 77.3% | 66.4% | 73.7% | -3.55% | 5.86% | 8.5% | ★★½ | ||
| 85 | Erlton | City Centre | $560,558 | 85.7% | 100.6% | 111.6% | -2.60% | 6.85% | 22.6% | ★★★ | ||
| 86 | Scenic Acres | Northwest | $518,317 | 95.2% | 93.0% | 103.2% | -4.09% | 6.16% | 20.5% | ★★★½ | ||
| 87 | Aspen Woods | West | $934,000 | 133.9% | 167.5% | 186.0% | -2.14% | 6.49% | 28.9% | ★★★★ | ||
| 88 | Oakridge | South | $606,617 | 126.7% | 108.8% | 120.8% | -2.84% | 8.70% | 23.6% | ★★★½ | ||
| 89 | Mayfair | City Centre | $1,089,050 | 166.4% | 195.4% | 216.8% | 0.34% | 8.21% | 41.6% | ★★★½ | ||
| 90 | West Hillhurst | City Centre | $695,600 | 106.3% | 124.8% | 138.5% | -3.32% | 4.71% | 24.4% | ★★★★ | ||
| 91 | Maple Ridge | South | $514,650 | 107.5% | 92.3% | 102.5% | 1.06% | 5.32% | 9.7% | ★★★ | ||
| 92 | Rocky Ridge | Northwest | $561,225 | 103.1% | 100.7% | 111.7% | -3.34% | 6.70% | 21.2% | ★★★ | ||
| 93 | Deer Run | South | $407,075 | 85.0% | 73.0% | 81.1% | -2.65% | 4.90% | 5.8% | ★★½ | ||
| 94 | Cougar Ridge | West | $668,683 | 95.9% | 119.9% | 133.1% | -0.41% | 7.13% | 27.4% | ★★★ | ||
| 95 | Braeside | South | $428,183 | 89.4% | 76.8% | 85.3% | -4.73% | 3.87% | 15.4% | ★★★ | ||
| 96 | Somerset | South | $447,083 | 93.4% | 80.2% | 89.0% | -4.17% | 5.11% | 15.7% | ★★★ | ||
| 97 | Mount Pleasant | City Centre | $565,058 | 86.3% | 101.4% | 112.5% | -4.32% | 9.03% | 16.8% | ★★★½ | ||
| 97 | Glenbrook | West | $492,233 | 70.6% | 88.3% | 98.0% | -3.46% | 3.69% | 15.7% | ★★★ | ||
| 99 | Rosscarrock | West | $532,367 | 76.3% | 95.5% | 106.0% | -2.43% | 8.39% | 15.3% | ★★★ | ||
| 99 | Hounsfield Heights/Briar Hill | City Centre | $754,817 | 115.3% | 135.4% | 150.3% | -3.40% | 6.64% | 24.5% | ★★★★ | ||
| 99 | Greenview | City Centre | $403,583 | 61.7% | 72.4% | 80.4% | -6.35% | 1.15% | 15.5% | ★★½ | ||
| 102 | Deer Ridge | South | $382,750 | 79.9% | 68.7% | 76.2% | -3.66% | 2.61% | 6.1% | ★★½ | ||
| 102 | St. Andrews Heights | City Centre | $782,567 | 119.6% | 140.4% | 155.8% | -3.24% | 6.35% | 28.5% | ★★★½ | ||
| 104 | Royal Oak | Northwest | $567,742 | 104.3% | 101.8% | 113.0% | -3.73% | 6.82% | 22.0% | ★★★ | ||
| 104 | Glendale | West | $559,900 | 80.3% | 100.4% | 111.5% | -3.44% | 4.54% | 21.1% | ★★★ | ||
| 106 | Auburn Bay | Southeast | $563,342 | 125.8% | 101.1% | 112.2% | -5.08% | 6.40% | 20.2% | ★★★½ | ||
| 106 | Winston Heights/Mountview | City Centre | $548,783 | 83.9% | 98.4% | 109.3% | -4.23% | 7.77% | 18.3% | ★★★ | ||
| 108 | Britannia | City Centre | $1,396,325 | 213.4% | 250.5% | 278.0% | -2.27% | 8.58% | 22.5% | ★★★★ | ||
| 108 | Highwood | City Centre | $471,392 | 72.0% | 84.6% | 93.9% | -5.72% | 4.62% | 16.8% | ★★★ | ||
| 110 | Spruce Cliff | West | $581,267 | 83.3% | 104.3% | 115.7% | -3.23% | 2.25% | 23.4% | ★★★½ | ||
| 111 | Sage Hill | North | $511,067 | 115.3% | 91.7% | 101.8% | -2.75% | 6.20% | 14.3% | ★★★ | ||
| 112 | Evergreen | South | $475,500 | 99.3% | 85.3% | 94.7% | -7.65% | 0.38% | 16.3% | ★★★ | ||
| 113 | Westgate | West | $503,358 | 72.2% | 90.3% | 100.2% | -4.05% | -0.90% | 16.8% | ★★★ | ||
| 114 | Crestmont | West | $704,467 | 101.0% | 126.4% | 140.3% | 0.08% | 7.22% | 29.0% | ★★★ | ||
| 115 | Woodbine | South | $495,442 | 103.5% | 88.9% | 98.6% | -4.97% | 5.79% | 16.1% | ★★★ | ||
| 115 | Lake Bonavista | South | $640,908 | 133.9% | 115.0% | 127.6% | 1.63% | 7.55% | 7.2% | ★★★★ | ||
| 117 | Valley Ridge | West | $627,533 | 90.0% | 112.6% | 124.9% | -1.98% | 6.64% | 25.3% | ★★★ | ||
| 118 | Chaparral | South | $505,533 | 105.6% | 90.7% | 100.7% | -3.41% | 4.82% | 14.0% | ★★★ | ||
| 118 | Sunnyside | City Centre | $572,142 | 87.4% | 102.6% | 113.9% | -3.27% | 6.34% | 14.9% | ★★★½ | ||
| 120 | Canyon Meadows | South | $495,775 | 103.5% | 88.9% | 98.7% | -3.80% | 4.54% | 14.8% | ★★★ | ||
| 120 | Highland Park | City Centre | $478,400 | 73.1% | 85.8% | 95.3% | -4.89% | 6.22% | 14.4% | ★★★ | ||
| 122 | Sundance | South | $482,083 | 100.7% | 86.5% | 96.0% | -3.85% | 6.47% | 7.2% | ★★★ | ||
| 122 | Capitol Hill | City Centre | $577,583 | 88.3% | 103.6% | 115.0% | -2.70% | 6.66% | 13.7% | ★★★½ | ||
| 122 | North Glenmore Park | West | $583,100 | 83.6% | 104.6% | 116.1% | -3.49% | 5.71% | 15.5% | ★★★½ | ||
| 125 | Woodlands | South | $476,850 | 99.6% | 85.5% | 94.9% | -4.18% | 4.59% | 12.9% | ★★★ | ||
| 125 | Parkland | South | $519,792 | 108.6% | 93.2% | 103.5% | -4.72% | 5.01% | 12.6% | ★★★½ | ||
| 127 | Collingwood | Northwest | $551,417 | 101.3% | 98.9% | 109.8% | -5.74% | 2.76% | 16.7% | ★★★½ | ||
| 128 | University Heights | Northwest | $782,658 | 143.8% | 140.4% | 155.8% | -4.25% | 0.53% | 24.6% | ★★★★ | ||
| 129 | Springbank Hill | West | $754,442 | 108.2% | 135.3% | 150.2% | -3.77% | 7.51% | 18.7% | ★★★★ | ||
| 130 | Cambrian Heights | City Centre | $521,467 | 79.7% | 93.5% | 103.8% | -6.63% | 1.76% | 14.3% | ★★★½ | ||
| 130 | Rosemont | City Centre | $586,242 | 89.6% | 105.2% | 116.7% | -5.63% | 3.52% | 19.0% | ★★★½ | ||
| 130 | Kincora | North | $545,325 | 123.0% | 97.8% | 108.6% | -2.83% | 3.82% | 13.1% | ★★★ | ||
| 130 | Rosedale | City Centre | $876,008 | 133.9% | 157.1% | 174.4% | -2.23% | 11.77% | 12.9% | ★★★★ | ||
| 134 | Palliser | South | $569,208 | 118.9% | 102.1% | 113.3% | -5.35% | 4.66% | 17.9% | ★★★½ | ||
| 134 | Silverado | South | $483,142 | 100.9% | 86.7% | 96.2% | -5.20% | 4.82% | 13.7% | ★★★ | ||
| 136 | Sunalta | City Centre | $426,692 | 65.2% | 76.5% | 85.0% | -10.46% | -5.62% | -27.8% | ★★★ | ||
| 137 | Wildwood | West | $570,533 | 81.8% | 102.3% | 113.6% | -4.56% | -0.76% | 15.4% | ★★★★ | ||
| 137 | Rutland Park | West | $550,975 | 79.0% | 98.8% | 109.7% | -4.46% | 5.73% | 13.9% | ★★★ | ||
| 139 | Killarney/Glengarry | City Centre | $561,400 | 85.8% | 100.7% | 111.8% | -3.66% | 3.14% | 8.2% | ★★★½ | ||
| 139 | Patterson | West | $914,650 | 131.1% | 164.1% | 182.1% | 1.22% | 8.18% | 15.9% | ★★★½ | ||
| 141 | Lakeview | West | $615,108 | 88.2% | 110.3% | 122.5% | -3.03% | 3.96% | 12.5% | ★★★½ | ||
| 142 | Windsor Park | City Centre | $554,075 | 84.7% | 99.4% | 110.3% | -5.26% | 6.55% | 7.4% | ★★★½ | ||
| 142 | Edgemont | Northwest | $637,525 | 117.1% | 114.4% | 126.9% | -1.34% | 7.90% | 4.9% | ★★★½ | ||
| 144 | Hillhurst | City Centre | $624,275 | 95.4% | 112.0% | 124.3% | -3.60% | 1.91% | 5.5% | ★★★★ | ||
| 145 | Shaganappi | City Centre | $570,100 | 87.1% | 102.3% | 113.5% | -2.35% | 4.09% | 8.6% | ★★★ | ||
| 146 | Kelvin Grove | South | $837,258 | 174.9% | 150.2% | 166.7% | -2.44% | 6.68% | 14.6% | ★★★½ | ||
| 147 | Bankview | City Centre | $500,483 | 76.5% | 89.8% | 99.6% | -3.96% | -1.33% | -9.6% | ★★★ | ||
| 147 | Sherwood | North | $588,592 | 132.8% | 105.6% | 117.2% | -2.49% | 7.79% | 15.3% | ★★½ | ||
| 149 | Parkdale | City Centre | $698,500 | 106.7% | 125.3% | 139.1% | -2.36% | 3.49% | 5.8% | ★★★★ | ||
| 149 | Diamond Cove | South | $564,758 | 118.0% | 101.3% | 112.4% | -0.68% | 2.90% | 3.7% | ★★★ | ||
| 151 | Elboya | City Centre | $808,142 | 123.5% | 145.0% | 160.9% | -4.79% | 6.48% | 15.2% | ★★★★ | ||
| 152 | Hamptons | Northwest | $790,992 | 145.3% | 141.9% | 157.5% | 0.23% | 9.94% | -4.9% | ★★★ | ||
| 152 | Varsity | Northwest | $665,783 | 122.3% | 119.4% | 132.6% | -9.22% | 2.11% | 9.4% | ★★★★ | ||
| 154 | Shawnee Slopes | South | $599,750 | 125.3% | 107.6% | 119.4% | -2.58% | 3.49% | 11.1% | ★★★ | ||
| 155 | Bayview | South | $1,119,242 | 233.8% | 200.8% | 222.8% | -2.57% | 8.66% | 10.1% | ★★★½ | ||
| 156 | Altadore | City Centre | $685,383 | 104.7% | 122.9% | 136.5% | -5.45% | 3.86% | 3.6% | ★★★★ | ||
| 157 | Cliff Bungalow | City Centre | $637,942 | 97.5% | 114.4% | 127.0% | -2.39% | 2.12% | -10.5% | ★★★½ | ||
| 158 | Scarboro | City Centre | $743,233 | 113.6% | 133.3% | 148.0% | -2.26% | -2.33% | -8.8% | ★★★½ | ||
| 159 | Christie Park | West | $778,617 | 111.6% | 139.7% | 155.0% | -3.30% | 0.98% | 12.3% | ★★★½ | ||
| 159 | Garrison Green | West | $747,683 | 107.2% | 134.1% | 148.9% | -2.03% | 4.77% | -1.7% | ★★★½ | ||
| 161 | South Calgary | City Centre | $631,550 | 96.5% | 113.3% | 125.7% | -4.35% | -0.40% | -0.5% | ★★★½ | ||
| 162 | Richmond | City Centre | $630,200 | 96.3% | 113.0% | 125.5% | -3.90% | 2.06% | 6.1% | ★★★ | ||
| 163 | Parkhill | City Centre | $684,300 | 104.6% | 122.8% | 136.2% | -6.56% | 2.33% | 4.5% | ★★★½ | ||
| 164 | Pump Hill | South | $1,040,183 | 217.3% | 186.6% | 207.1% | -6.18% | 2.83% | 6.3% | ★★★★ | ||
| 165 | Discovery Ridge | West | $880,517 | 126.2% | 157.9% | 175.3% | -3.46% | 6.13% | 6.7% | ★★★ | ||
| 166 | Signal Hill | West | $685,333 | 98.3% | 122.9% | 136.5% | -6.38% | 1.64% | 2.8% | ★★★½ | ||
| 167 | Bel-Aire | City Centre | $1,604,550 | 245.2% | 287.8% | 319.5% | -5.84% | 5.08% | -2.6% | ★★★★ | ||
| 168 | Scarboro/Sunalta West | City Centre | $782,742 | 119.6% | 140.4% | 155.8% | -4.33% | -4.24% | 12.0% | ★★★½ | ||
| 169 | Upper Mount Royal | City Centre | $1,329,083 | 203.1% | 238.4% | 264.6% | -8.22% | -4.65% | -9.7% | ★★★★ | ||
| 170 | Elbow Park | City Centre | $1,095,475 | 167.4% | 196.5% | 218.1% | -12.15% | -9.51% | -11.3% | ★★★★ |
Share this article Share on Facebook Share on Twitter Share on Linkedin Share on Reddit Share on Email
Advertisement
If your landlord defaults and the home is sold, your tenancy may still be protected—but rules vary by province....
Thinking of selling your home without a Realtor? Here’s what DIY sellers need to know about commissions, legal risks,...

Short-term rentals can help cover housing costs, but experts say many first-time hosts underestimate the legal, financial, and lifestyle...

As falling home prices leave more Canadians underwater on their mortgages, experts explain the refinancing and renewal options available.

Buying a home can change your life insurance needs fast. Here’s how much coverage young Canadians may actually need—and...

Bank of Canada holds its 2.25% rate for a fourth time amid inflation risks from oil prices, affecting mortgages,...